This Week’s Market: Prom Night is Over?
March 31, 2022 - By Brett Friedman, OptionStrat Contributor
Volatility Roundup
- As we noted at the start of last week, the bull market was starting to feel like prom night at 3am. For traders new and old, last week was a wild ride with some whiplash-inducing intraday swings. One interesting note: for all the intraday craziness, option implied volatility wound up more or less unchanged for the week.
- Given the price action, this was not surprising. Volatility reacts to uncertainty and anxiety, and at this point, downside action is considered to be a lot more uncertain than a continuation of the bull market. With all the talk over the last few months of bubbles, inflation, war, and pandemics, many thought that a 2008-like crash or worse was finally taking place. At long last, were all the purveyors of apocalypse porn finally right? Was it time to get into the bunker? Apparently not, and you could hear a collective “Phew!“ resound through the markets. The ultimate result: after a few nail-biting hours and days, volatility wound up to be a non-event.
- Regardless, many traders saw their life flash before their eyes last week and will remain jittery until intraday volatility calms down consistently. Don’t expect options to become much cheaper on a volatility basis until that occurs.
- Peloton, DoorDash, and Wayfair: Bottom pickers beware!
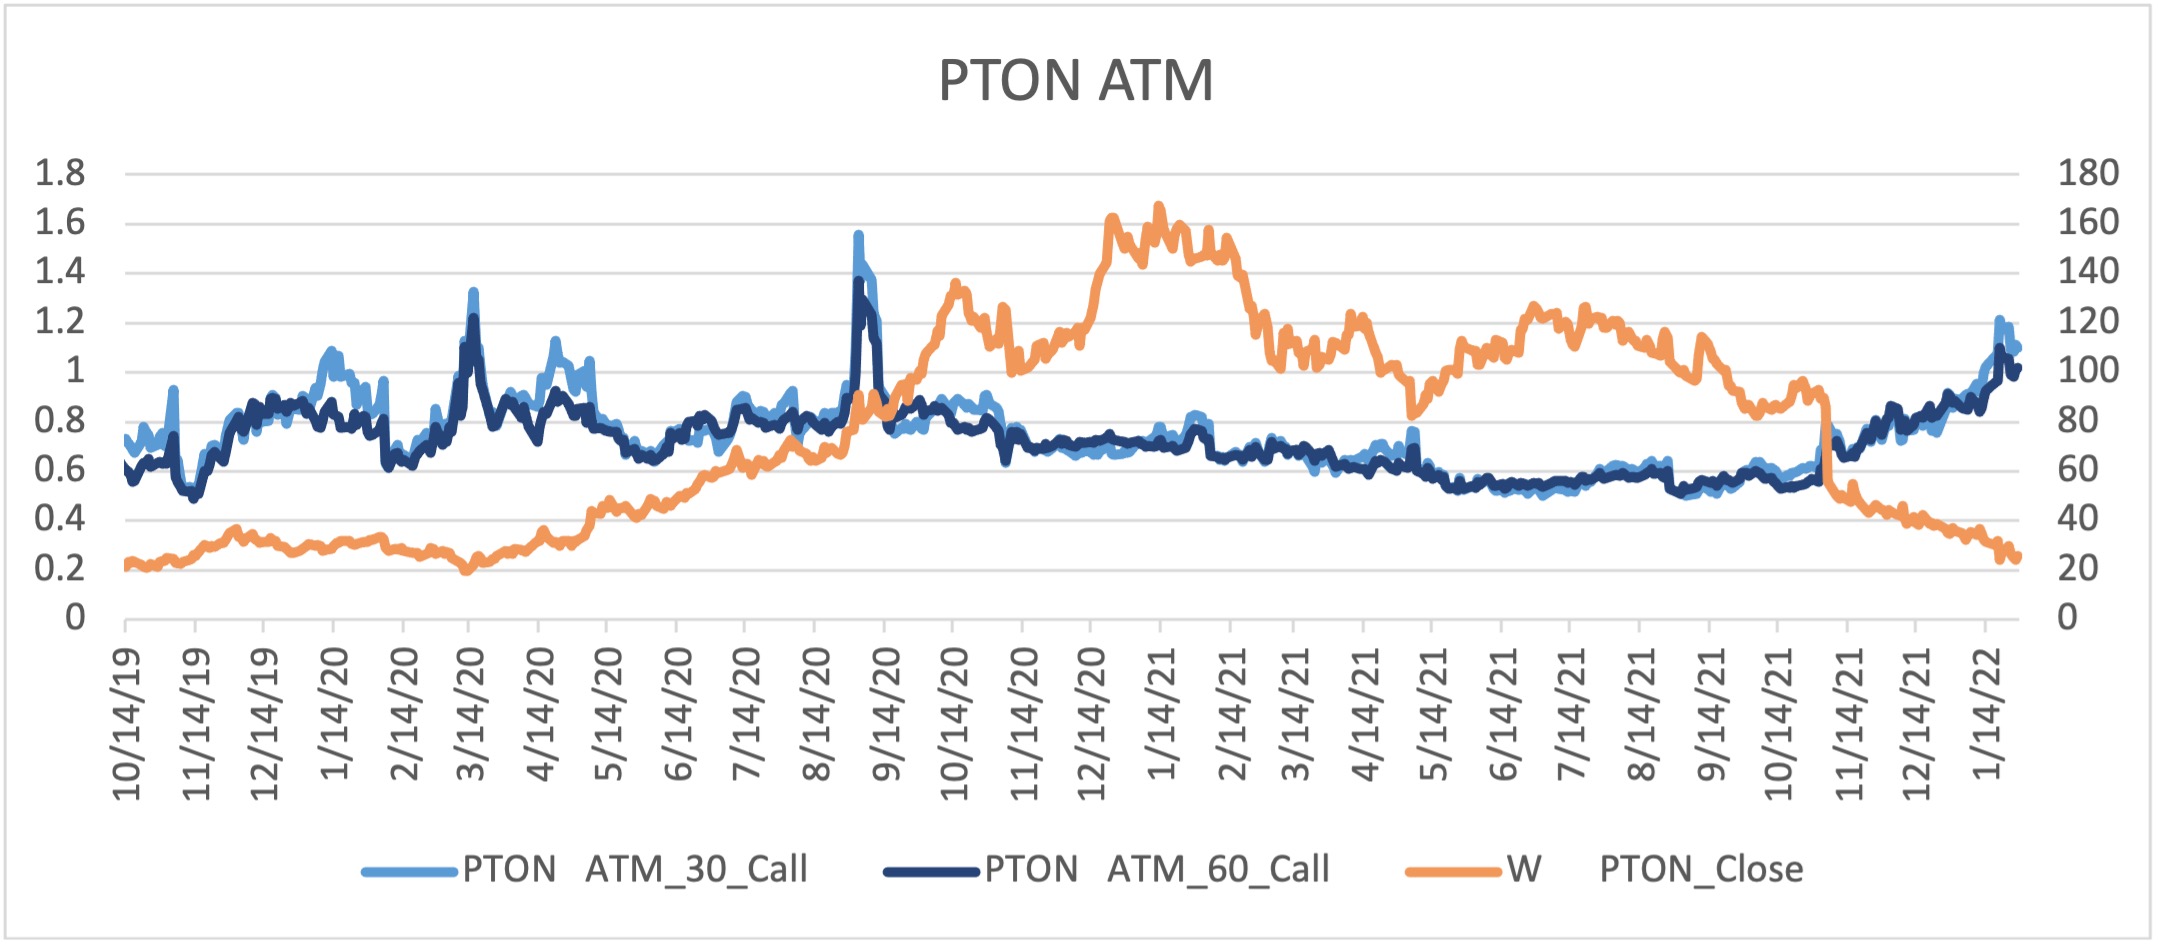
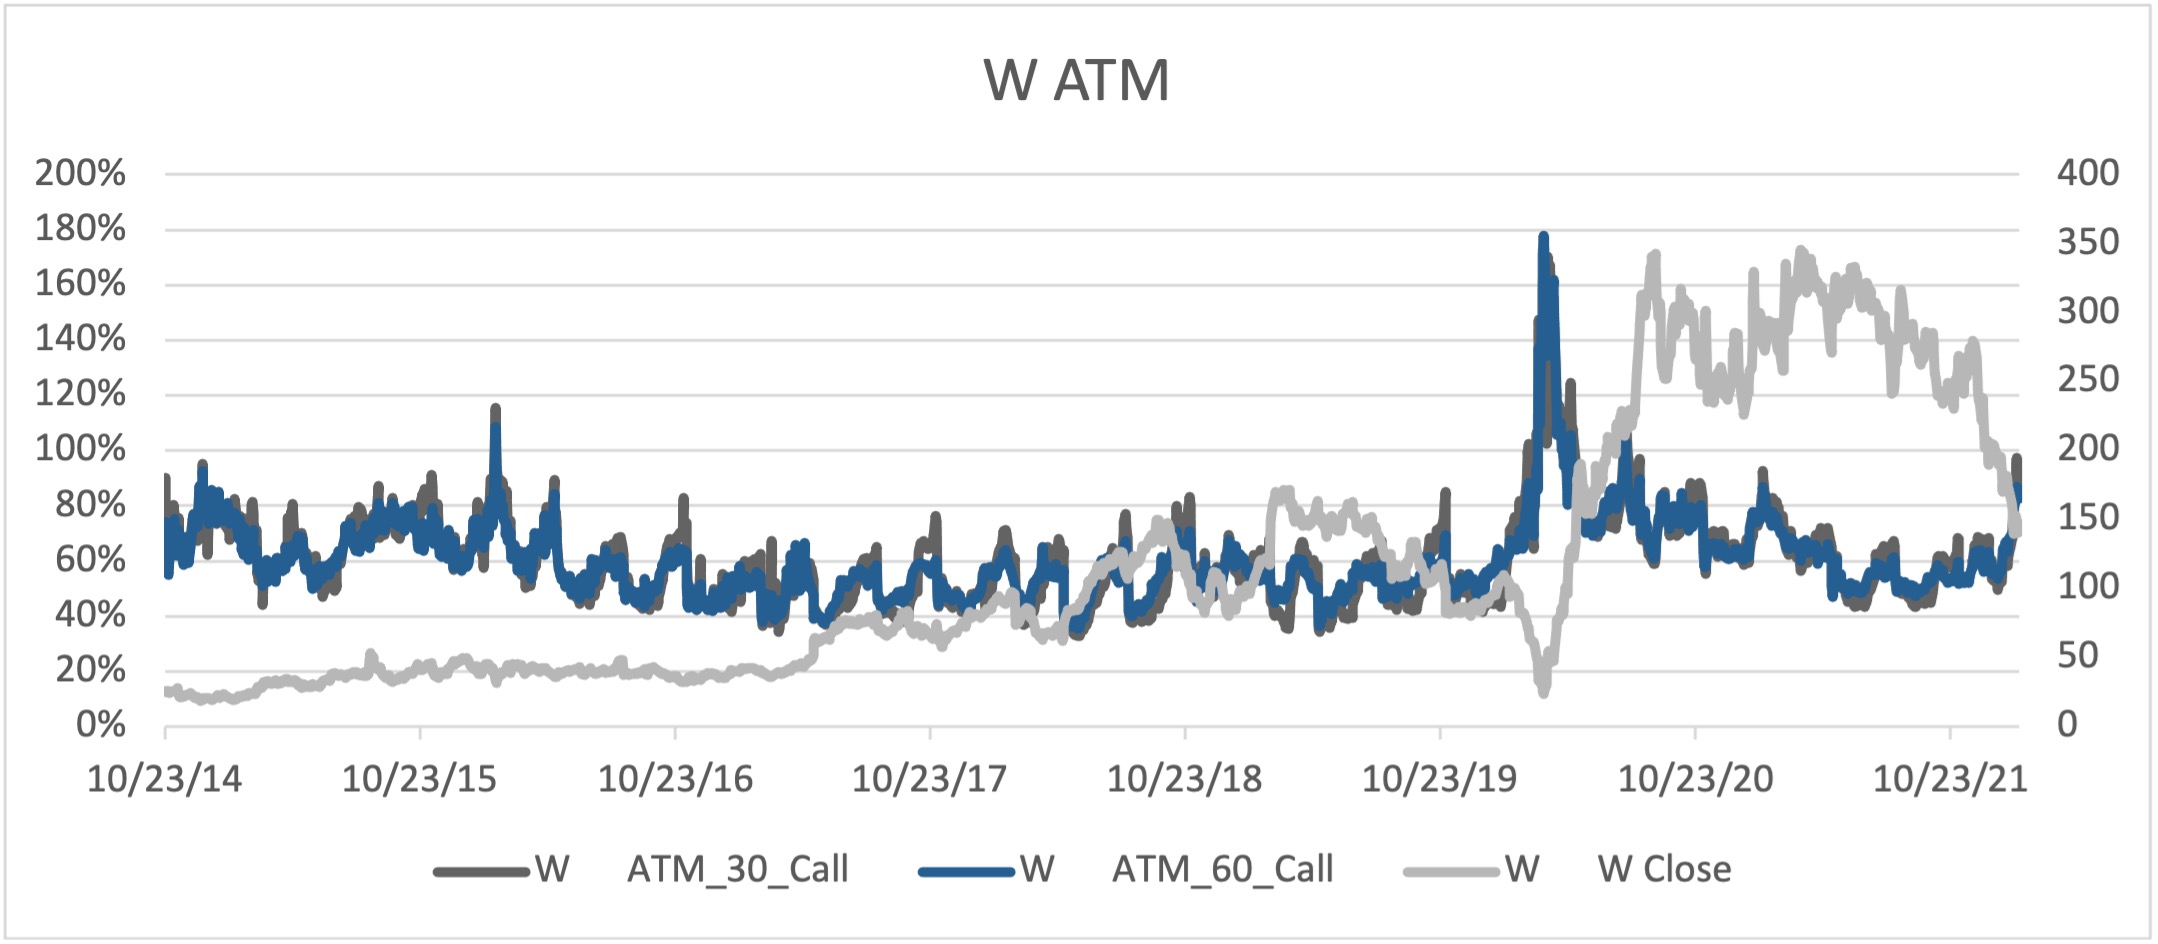
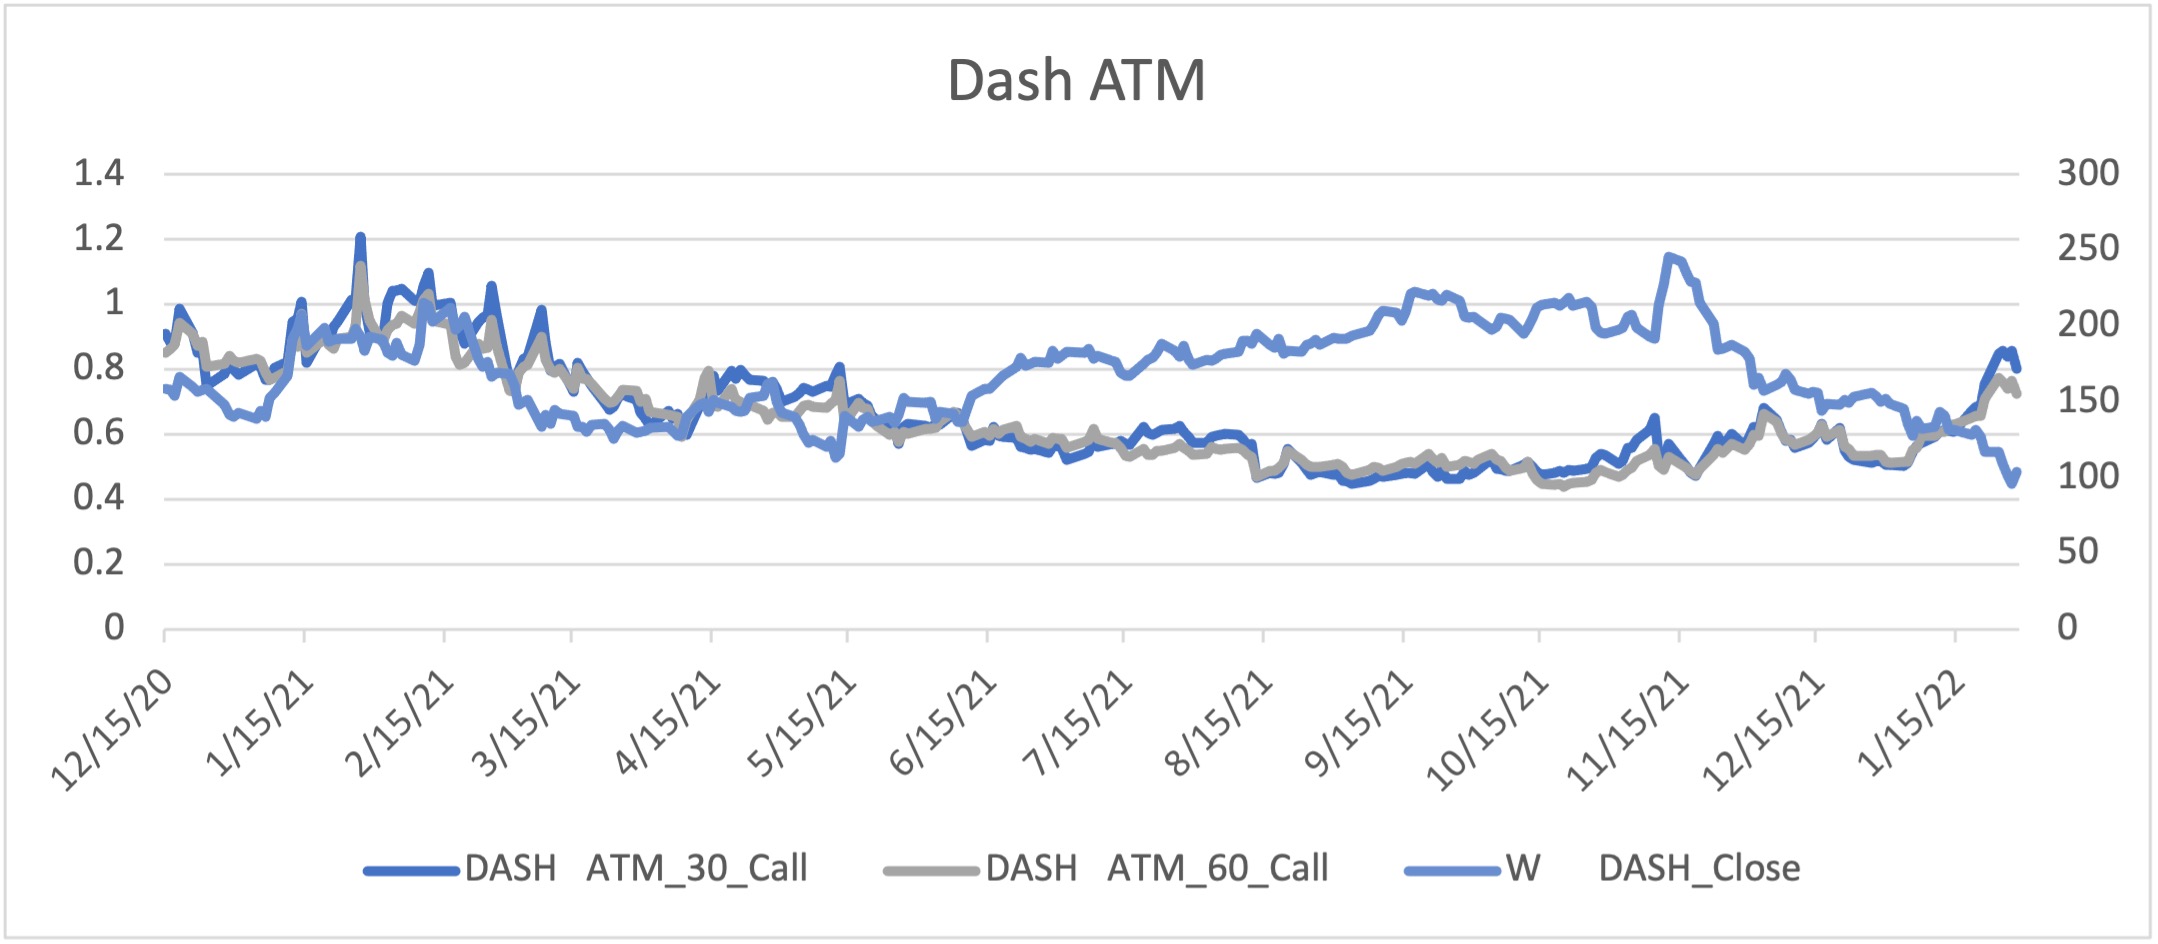
- Peloton (PTON) continues to trade at elevated implied volatility levels (#1 this week and last), reflecting its crash from over $90 at the end of last October to its current level of about $24. Its volatility should remain elevated until its price recovers and the company gets out of the news. Another former highflier, DoorDash (DASH), is in a similar situation: the stock is off by more than half since last November, but its implied volatility is up sharply since then. Finally, Wayfair (W) displays similar characteristics, but to a lesser extent. For all three stocks, price recovery could mean a sharp decline in implied volatility and relative premium levels. Option traders looking to bottom pick should consider this when selecting a strategy.
Top 10 Implied Volatility Rankings
| Ranking | Name (Ticker) | Sector | Implied Volatility (%) | Implied Volatility, Absolute Change (%) | Historical Volatility (%) | Historical Volatility, Absolute Change (%) |
|---|---|---|---|---|---|---|
| 1 | PTON | Health/Fitness | 112 | -7 | 137 | 10 |
| 2 | ENPH | Energy | 93 | 7 | 56 | 3 |
| 3 | W | e-Commerce | 88 | 6 | 68 | 14 |
| 4 | PLTR | Software | 84 | 6 | 49 | 2 |
| 5 | DASH | e-Commerce | 83 | 6 | 78 | 11 |
| 6 | MRNA | Pharmaceuticals | 82 | 0 | 74 | 5 |
| 7 | PENN | Gaming | 76 | 0 | 46 | 6 |
| 8 | ETSY | e-Commerce | 74 | 1 | 55 | 7 |
| 9 | TWTR | Social Media | 70 | 0 | 42 | 4 |
| 10 | TSLA | Autos | 65 | -9 | 78 | 6 |


Methodology: Rankings include 500 of the largest public companies (by market cap) traded on the NYSE, NASDAQ, or CBOE. All changes are measured over the Friday/previous Friday period; all metrics are based on exchange-provided settlement prices. Implied volatilities represent a 30-day expiration and 0.5 delta, calculated using volatility surface methodologies provided by OptionMetrics.
Options involve a high degree of risk and are not suitable for all investors. OptionStrat is not a registered investment advisor. The calculations, information, and opinions on this site are for educational purposes only and do not constitute investment advice. Calculations are estimates and do not account for all market conditions and events.