Bottom Pickers Beware! Decreased Volatility and Market Jitters in this Week’s Volatility Roundup
Weekly Volatility Roundup
Week Ending: 02/04/2022
- Dare I say it? Volatility actually decreased last week! Of course, some stocks looked like they were knocking on the Gates of Hell (Read: Facebook, last Monday), but that only tended to obscure the general downward trend in volatility.
- Out of universe of 507 stocks, only 35 managed to post an increase in implied volatility; for the week, the average decreased by 3%. You wouldn’t know that by listening to the financial press screaming about Facebook — “the biggest one-day decline in the history of the stock market!” Again, everyone likes to watch a subway fight (as long as you’re not involved!).
- Regardless, the market is clearly jittery, more so than usual, and has punished the Covid stay-at-home stocks that have failed to perform and those related to it somehow (Facebook taking Netflix down along with it). Unlike many commentators, the market is signaling that Covid is over, at least for now.
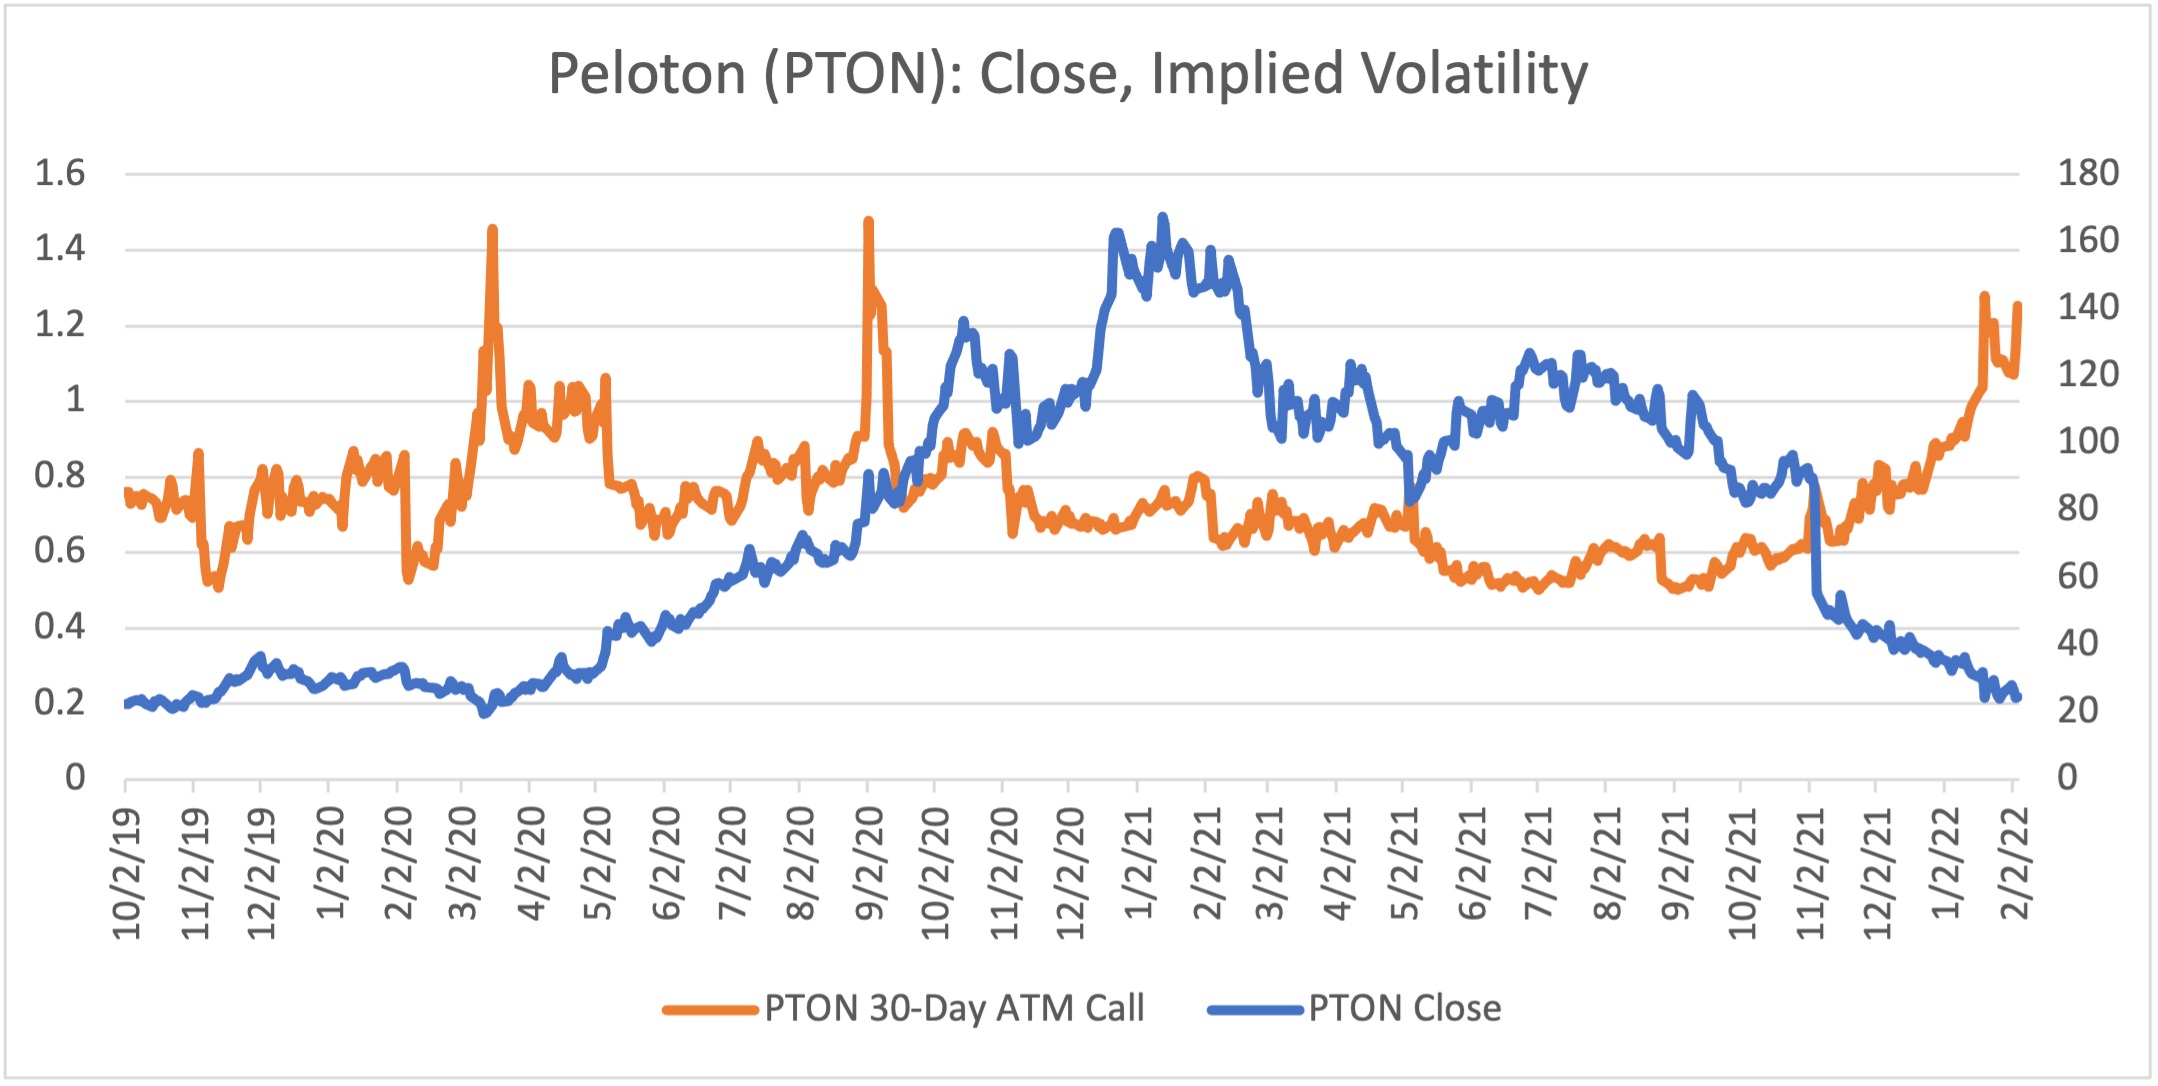
- For those tempted to bottom pick certain stocks that have been beaten down due to Covid or tech jitters by buying options or other long volatility strategies, caveat emptor. Although their prices may certainly recover, their implied volatilities should decrease as their “normal” price action resumes. Implied volatility reacts to uncertainty, and these stocks are no different. Decreases in volatility will act as a brake to any profits derived from the price move. Frustrating! See the charts below to see the historical relationship between price and implied volatility.
- Interestingly, GameStop shows an opposite pattern: volatility increases as its price increases since it is considered the direction with more uncertainty. Consequently, long option (volatility) positions will get a significant kicker if the stock explodes again.
Top 10 Implied Volatility:
| Ranking | Name (Ticker) | Sector | Implied Volatility (%) | IV Absolute Change (%) | Historical Volatility (%) | HV Absolute Change (%) |
|---|---|---|---|---|---|---|
| 1 | PTON | Health/Fitness | 126 | 14 | 140 | 3 |
| 2 | GME | Meme | 114 | -11 | 90 | 8 |
| 3 | DASH | e-Commerce | 97 | 8 | 99 | 21 |
| 4 | W | e-Commerce | 91 | 3 | 77 | 9 |
| 5 | ENPH | Energy | 88 | -5 | 69 | 12 |
| 6 | PLTR | Software | 84 | 0 | 63 | 14 |
| 7 | ETSY | e-Commerce | 81 | 7 | 74 | 20 |
| 8 | TWTR | Social Media | 81 | 10 | 55 | 13 |
| 9 | MRNA | Pharmaceuticals | 79 | -4 | 73 | -1 |
| 10 | UBER | e-Commerce | 75 | 8 | 62 | 16 |
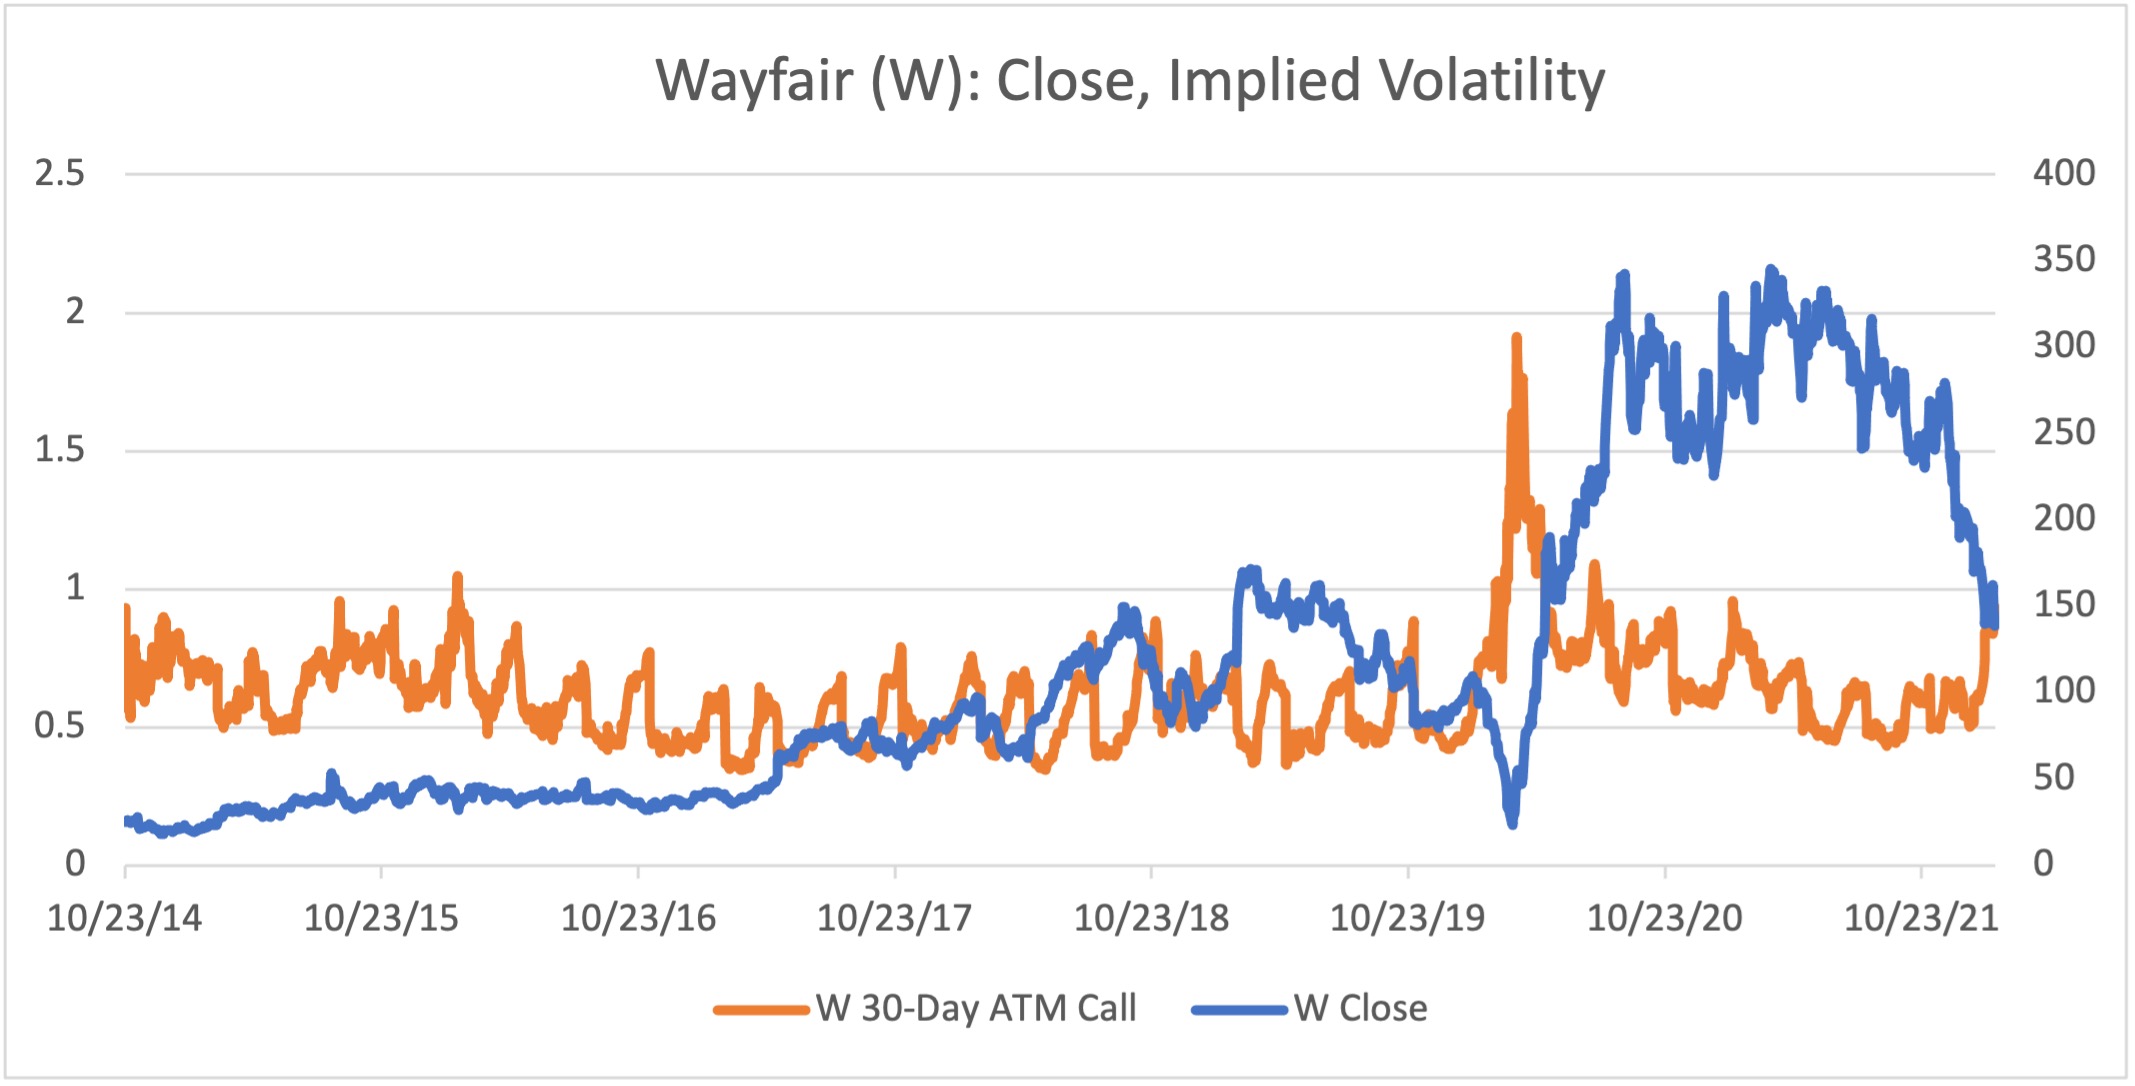
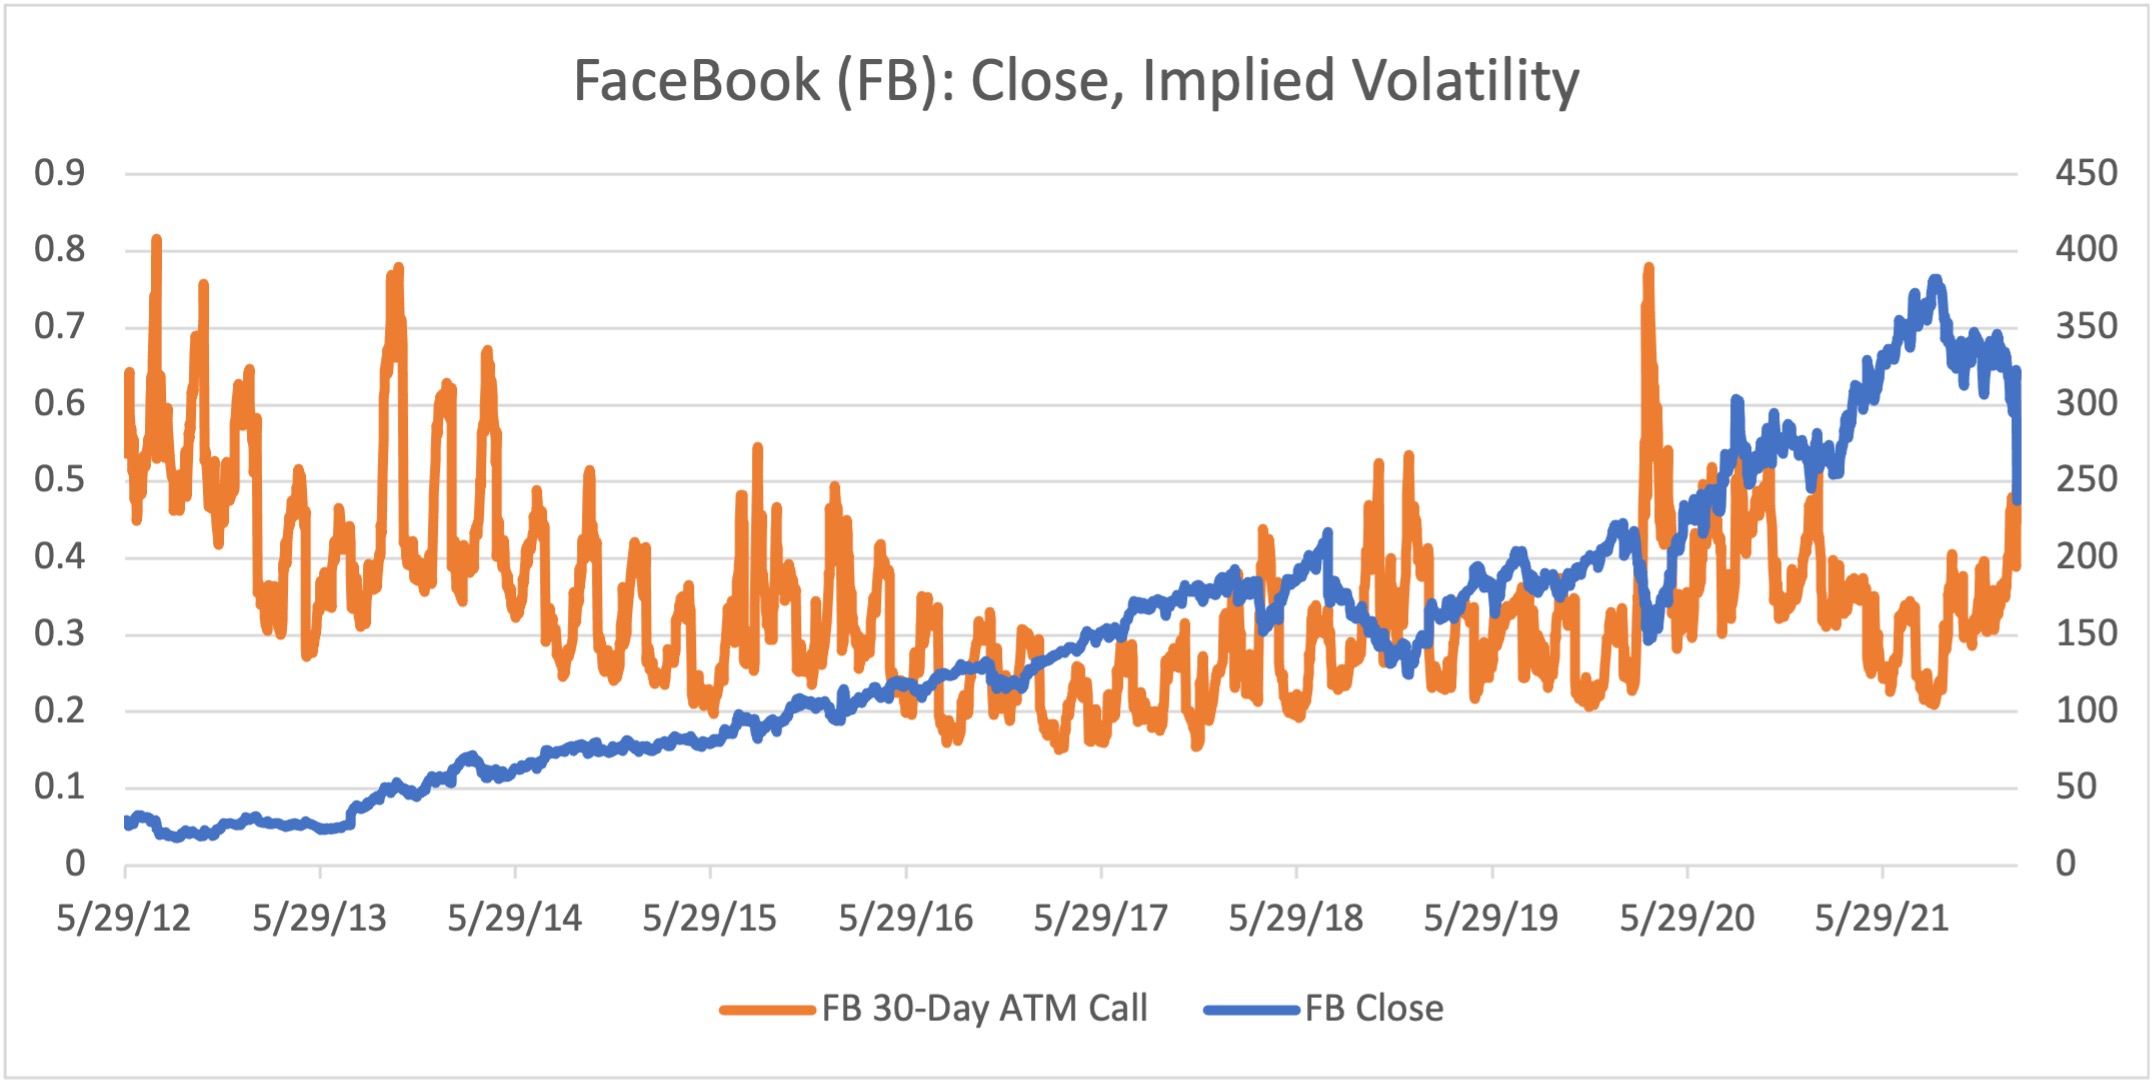
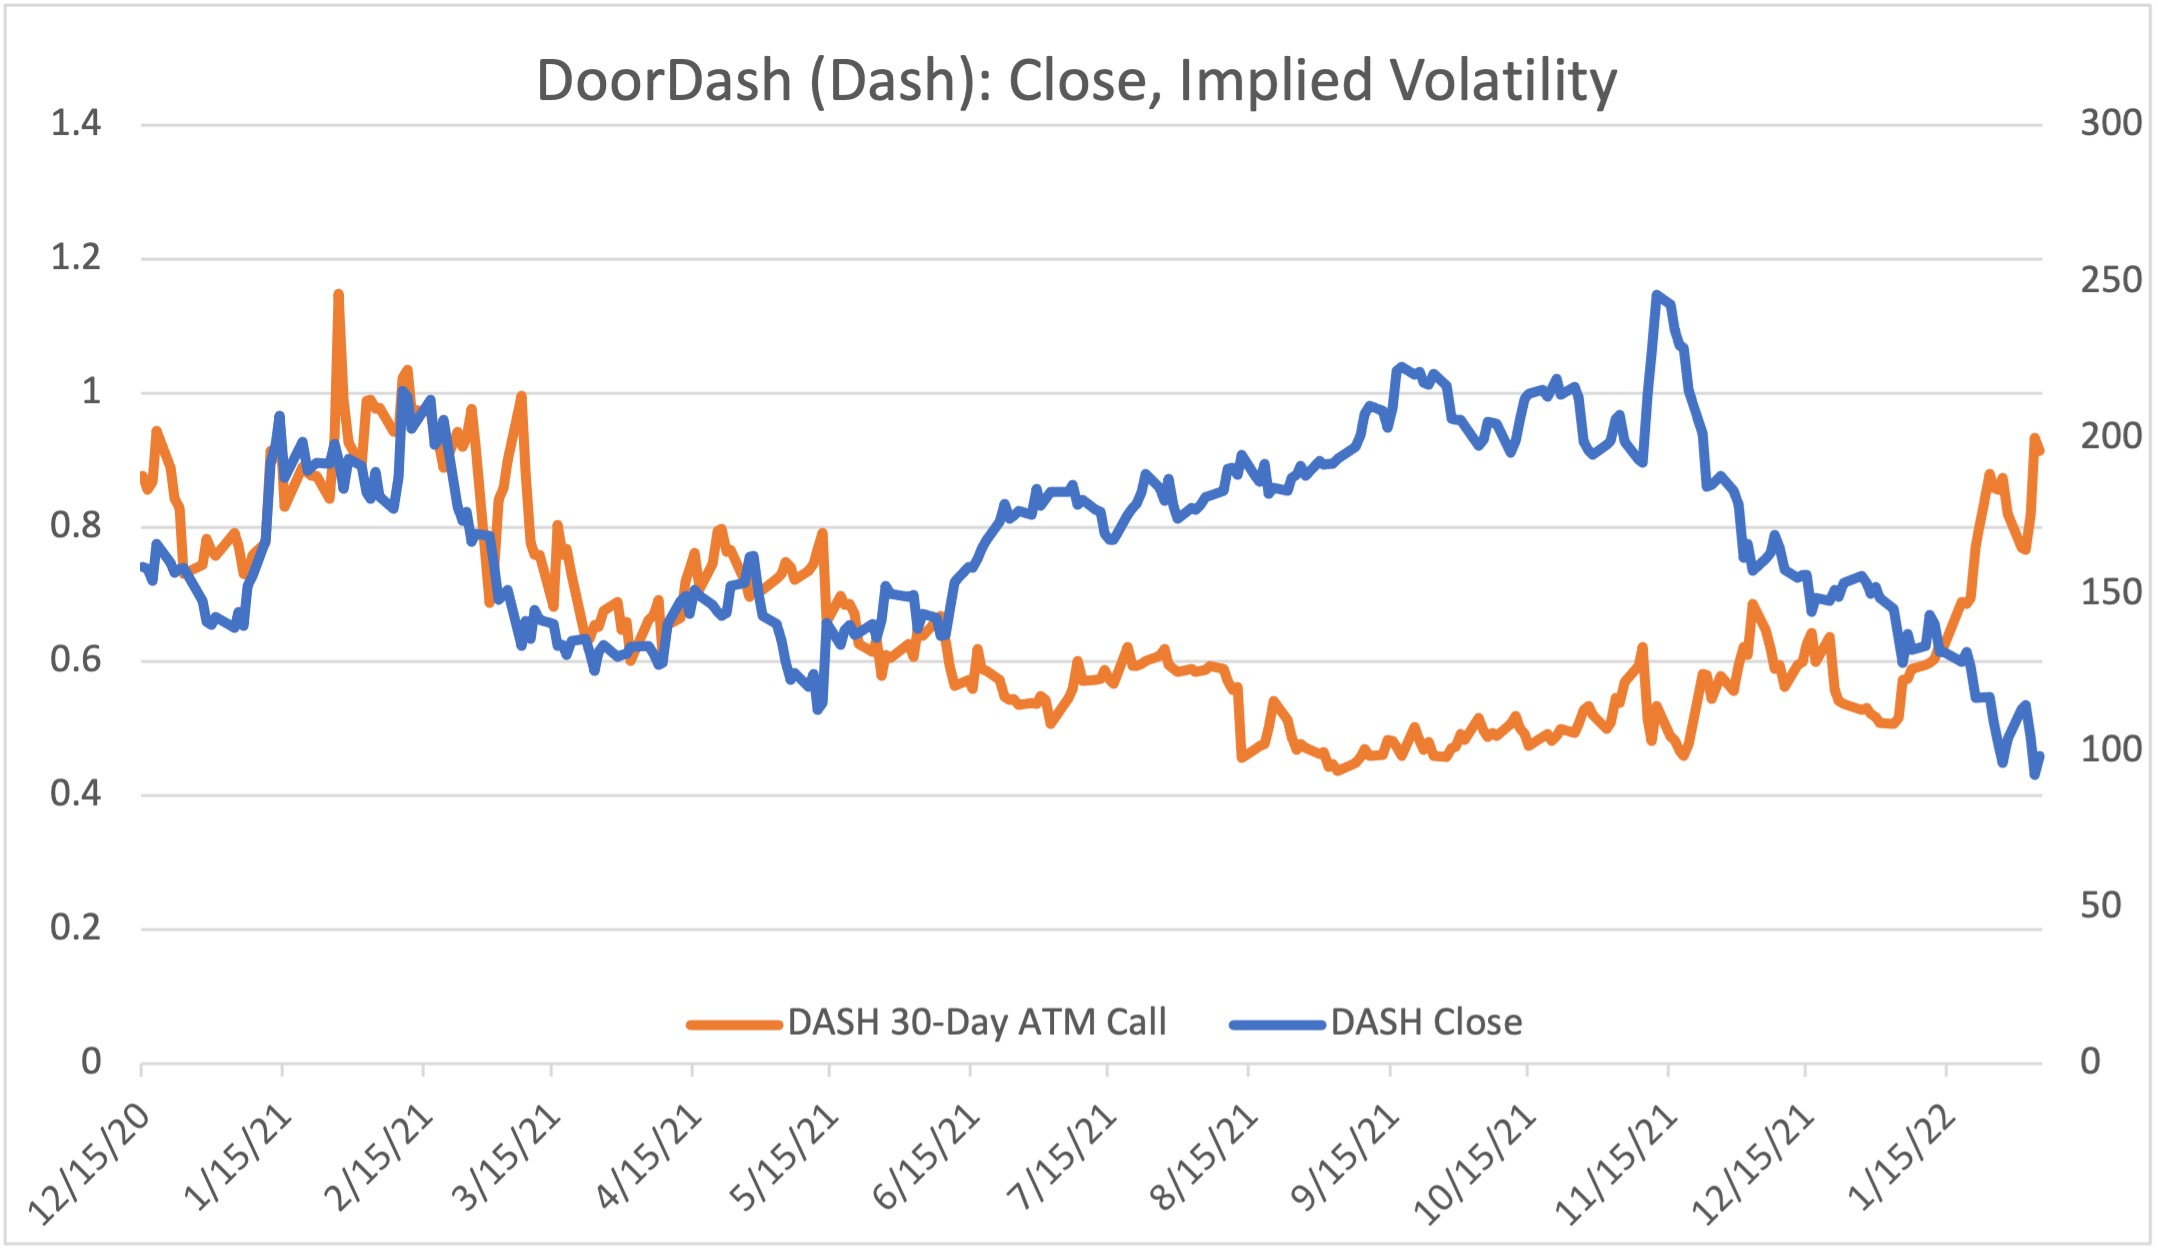
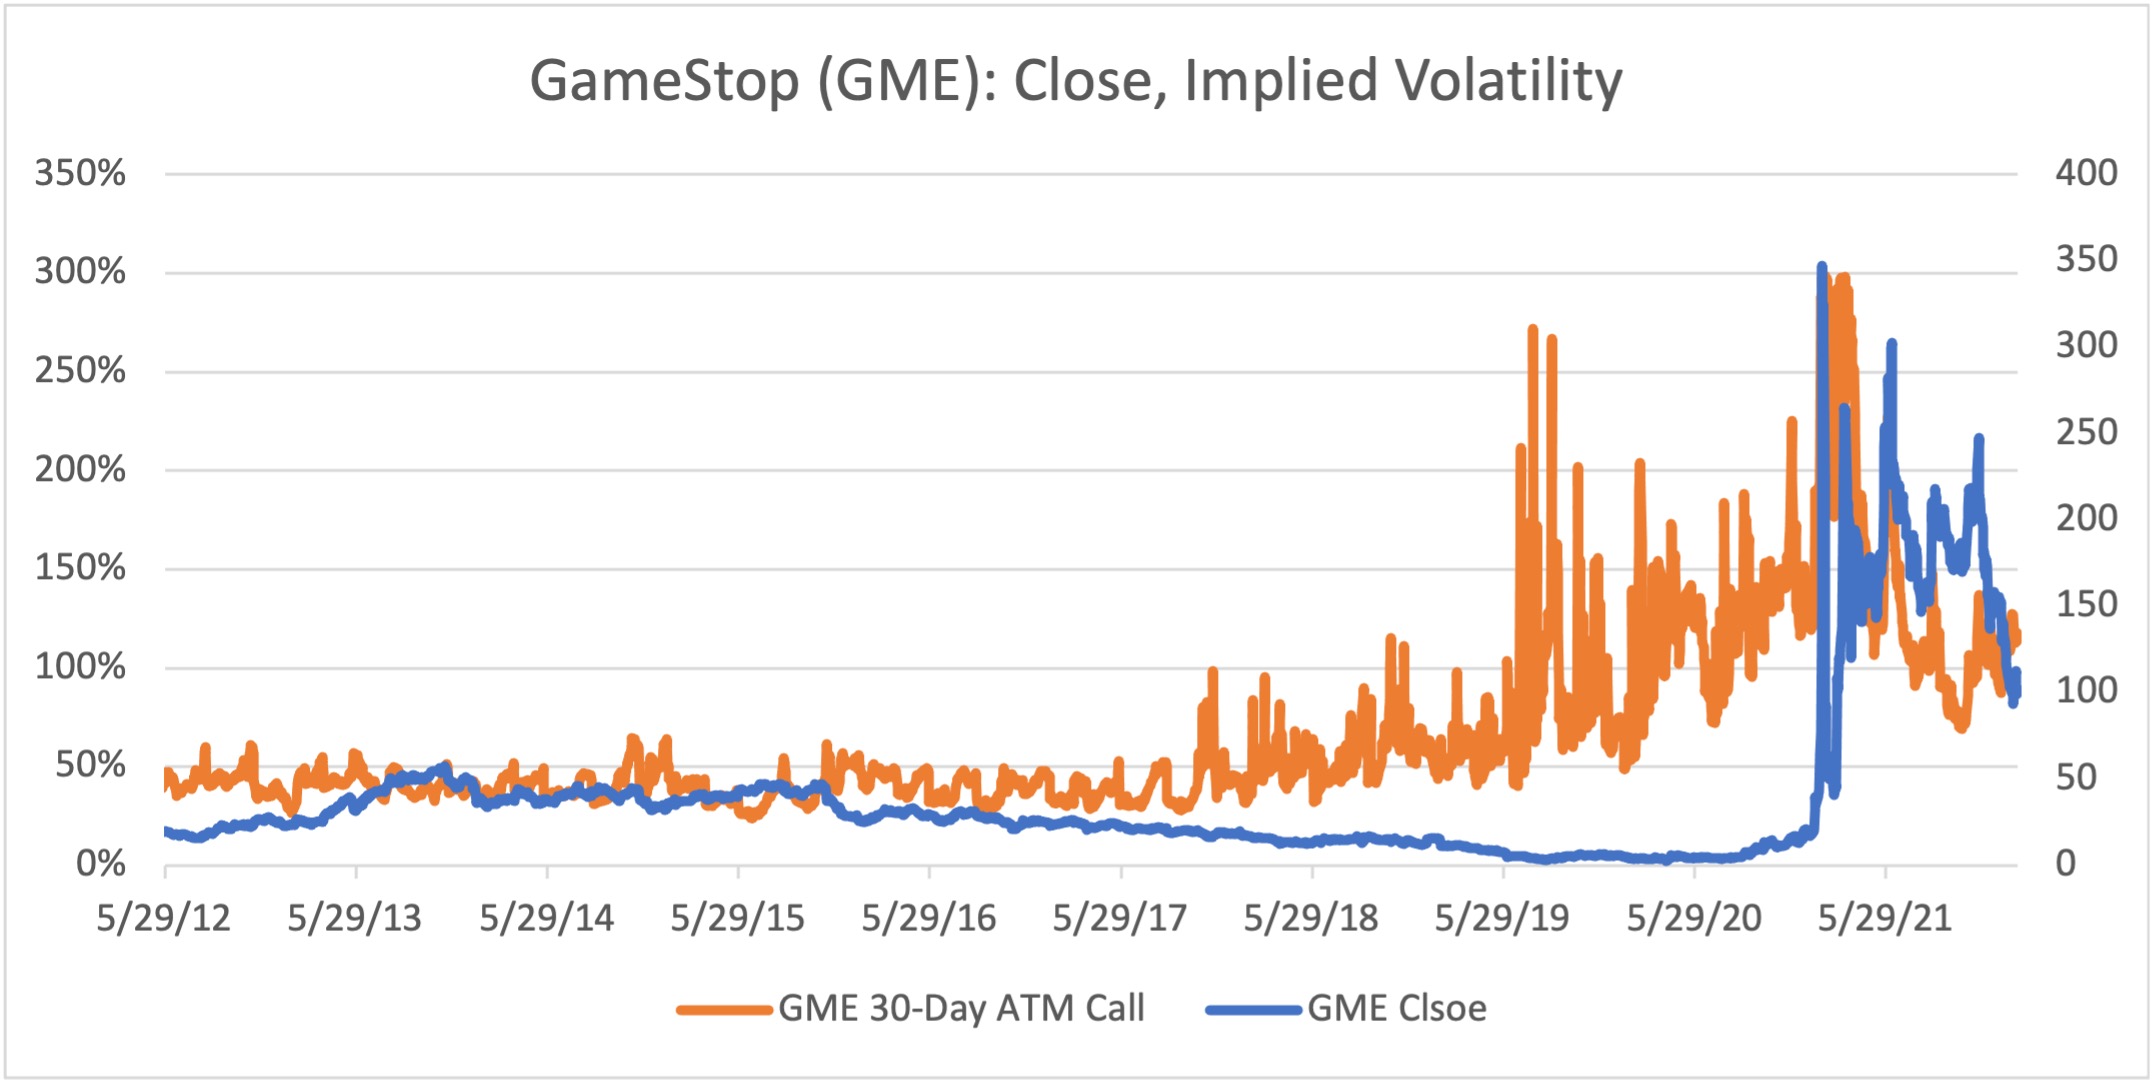
Methodology: Rankings include 500 of the largest public companies (by market cap) traded on the NYSE, NASDAQ, or CBOE. All changes are measured over the Friday/previous Friday period; all metrics are based on exchange-provided settlement prices. Implied volatilities represent a 30-day expiration and 0.5 delta, calculated using volatility surface methodologies provided by OptionMetrics.
Options involve a high degree of risk and are not suitable for all investors. OptionStrat is not a registered investment advisor. The calculations, information, and opinions on this site are for educational purposes only and do not constitute investment advice. Calculations are estimates and do not account for all market conditions and events.