Equity it Is! Peloton Cycles On & Real War Worries in this Week’s Volatility Roundup
Week Ending: 02/11/2022
- After a week or so off, the Russian/Ukraine faceoff is back on the front page and above the fold.
- Despite the renewed frenzy in the press, there’s not much new information. The Russians have the place surrounded and are waging “hybrid war” (I love it when wonky Pentagon/poli-sci phrases go mainstream) using cyberattacks, bomb threats, economic warfare, and other sneaky stuff. My conclusions regarding its effect on options volatility are the same as I previously wrote: “This will not only affect natural gas, crude oil, power, and LNG directly, but will also impact stocks in energy, defense, and agriculture (Russian and Ukraine are major suppliers of wheat and corn).” Commodities are the main play here, but most retail investors don’t have the stomach (nor the bank accounts) to handle their volatility. So, equity it is!
- Whatever the investment vehicle, for options traders, it’s important to understand that price movement, up or down, does not necessarily correlate to corresponding moves in implied volatility. As I’ve written in previous notes, uncertainty and anxiety drives implied volatility. Think of it this way: if you had perfect knowledge of future prices, option prices would be zero – you would know exactly where the stock price would be at expiration. But no one has that information (and if you do, please let me know!), so one must pay a premium to the options seller to get them to incur the risk. Since the option seller also does not have a price crystal ball either, they must charge more as price uncertainty and risk increases.
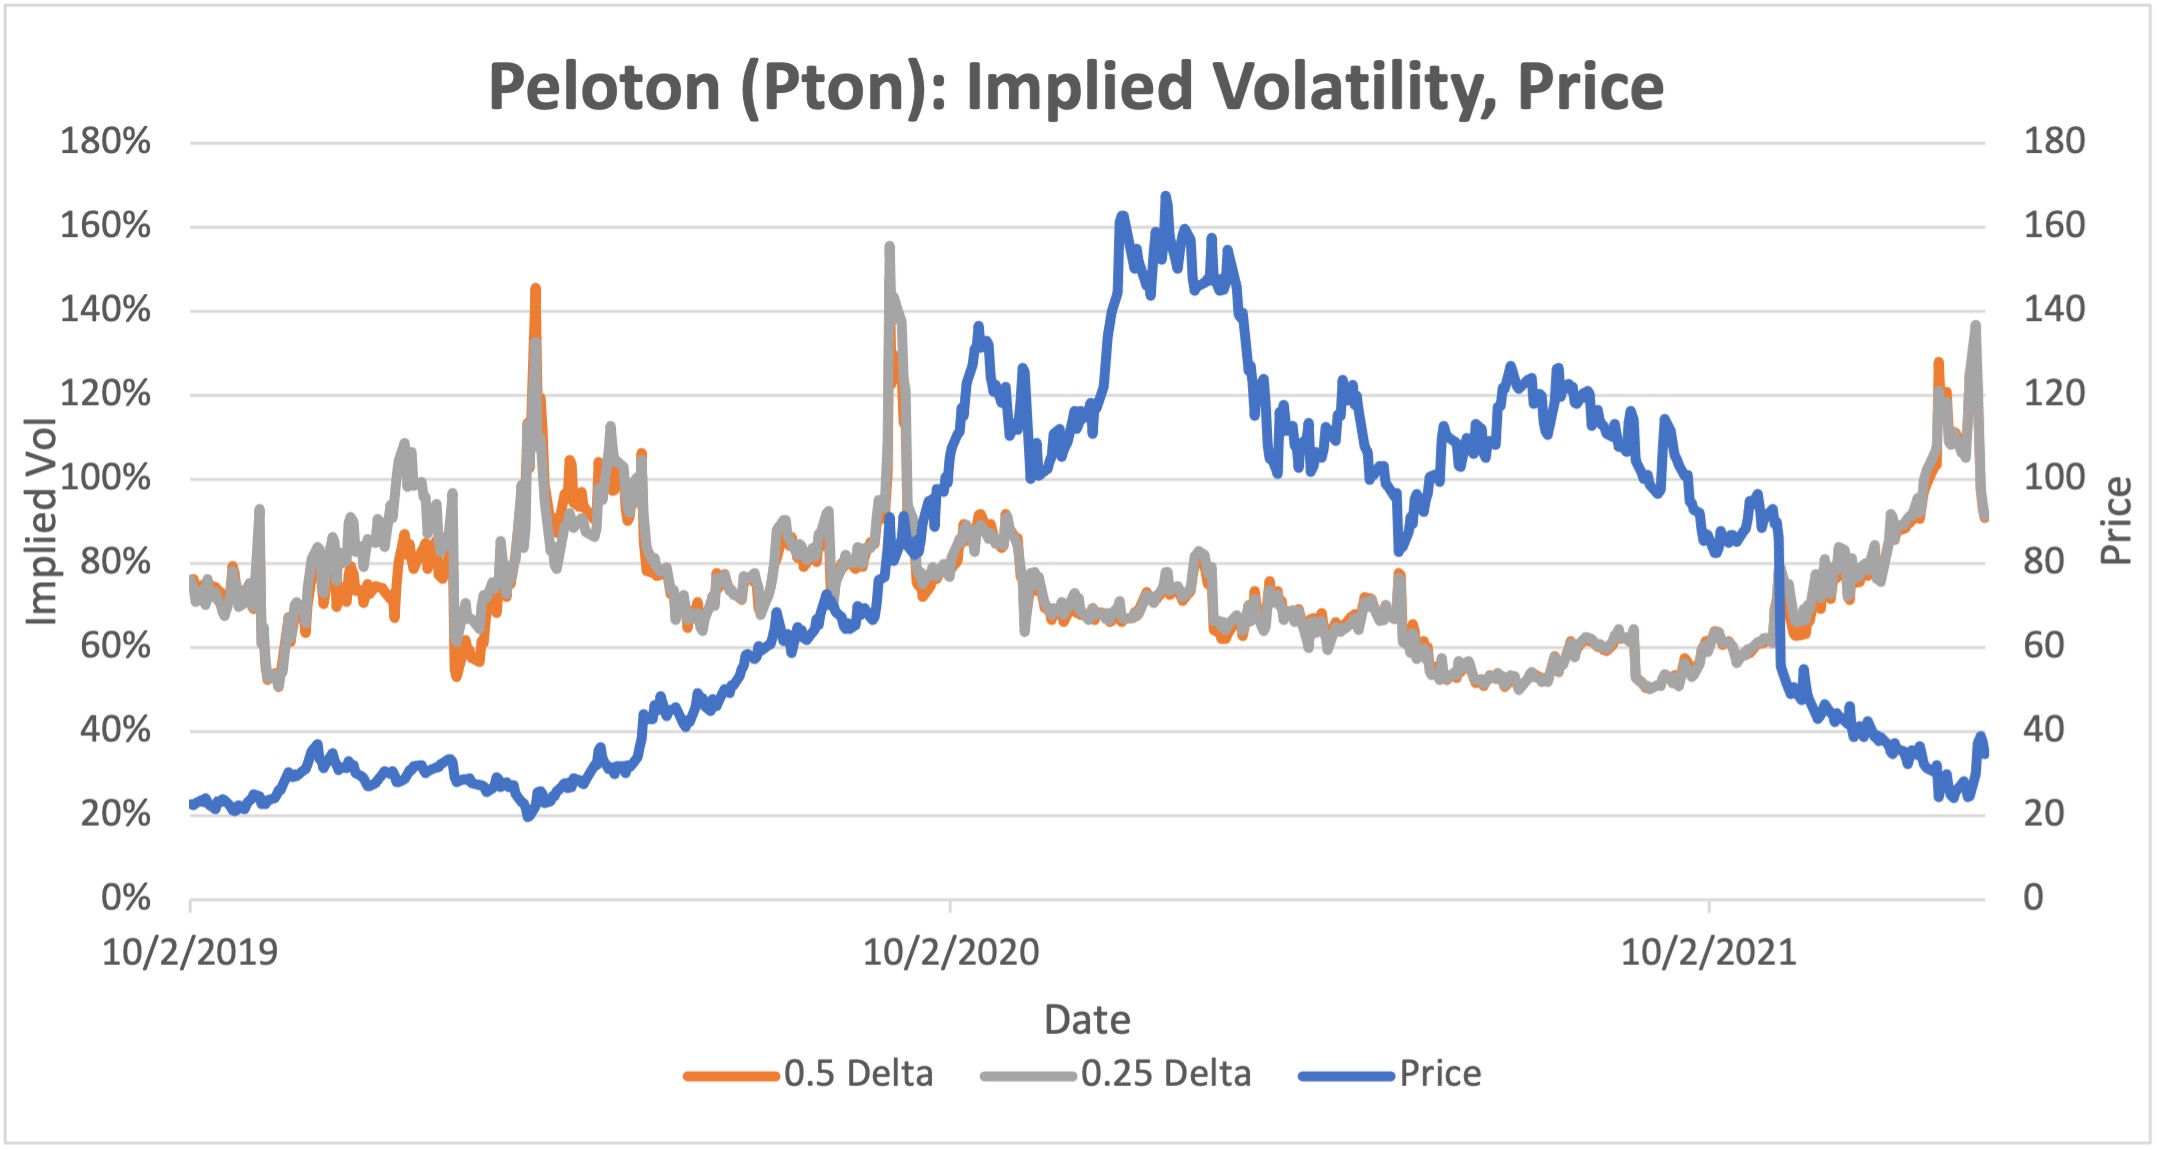
- A great example of this is the ongoing drama surrounding Peloton (PTON, see chart below). As I noted previously, the luster has largely worn off the sectors that originally benefited from the Covid inspired stay-at-home craze. Peloton was part of this group, but also had the extra special attraction of thinking that Covid would go on forever. Last week, and after much speculation and anticipation, various bouts of incompetence finally led to the departure of the Founder and CEO (but…he still owns the majority of voting stock so he’s now Peloton’s version of Lord Voldemort). Regardless, uncertainty was relieved, and the market was assured by the installation of new, adult management. Consequently, implied volatility, which had surged to a high of over 125% just a few weeks ago, declined by a whopping 35% last week. As I wrote last week, bottom pickers looking to buy the stock using options strategies will face an implied volatility headwind as the stock recovers or stabilizes.
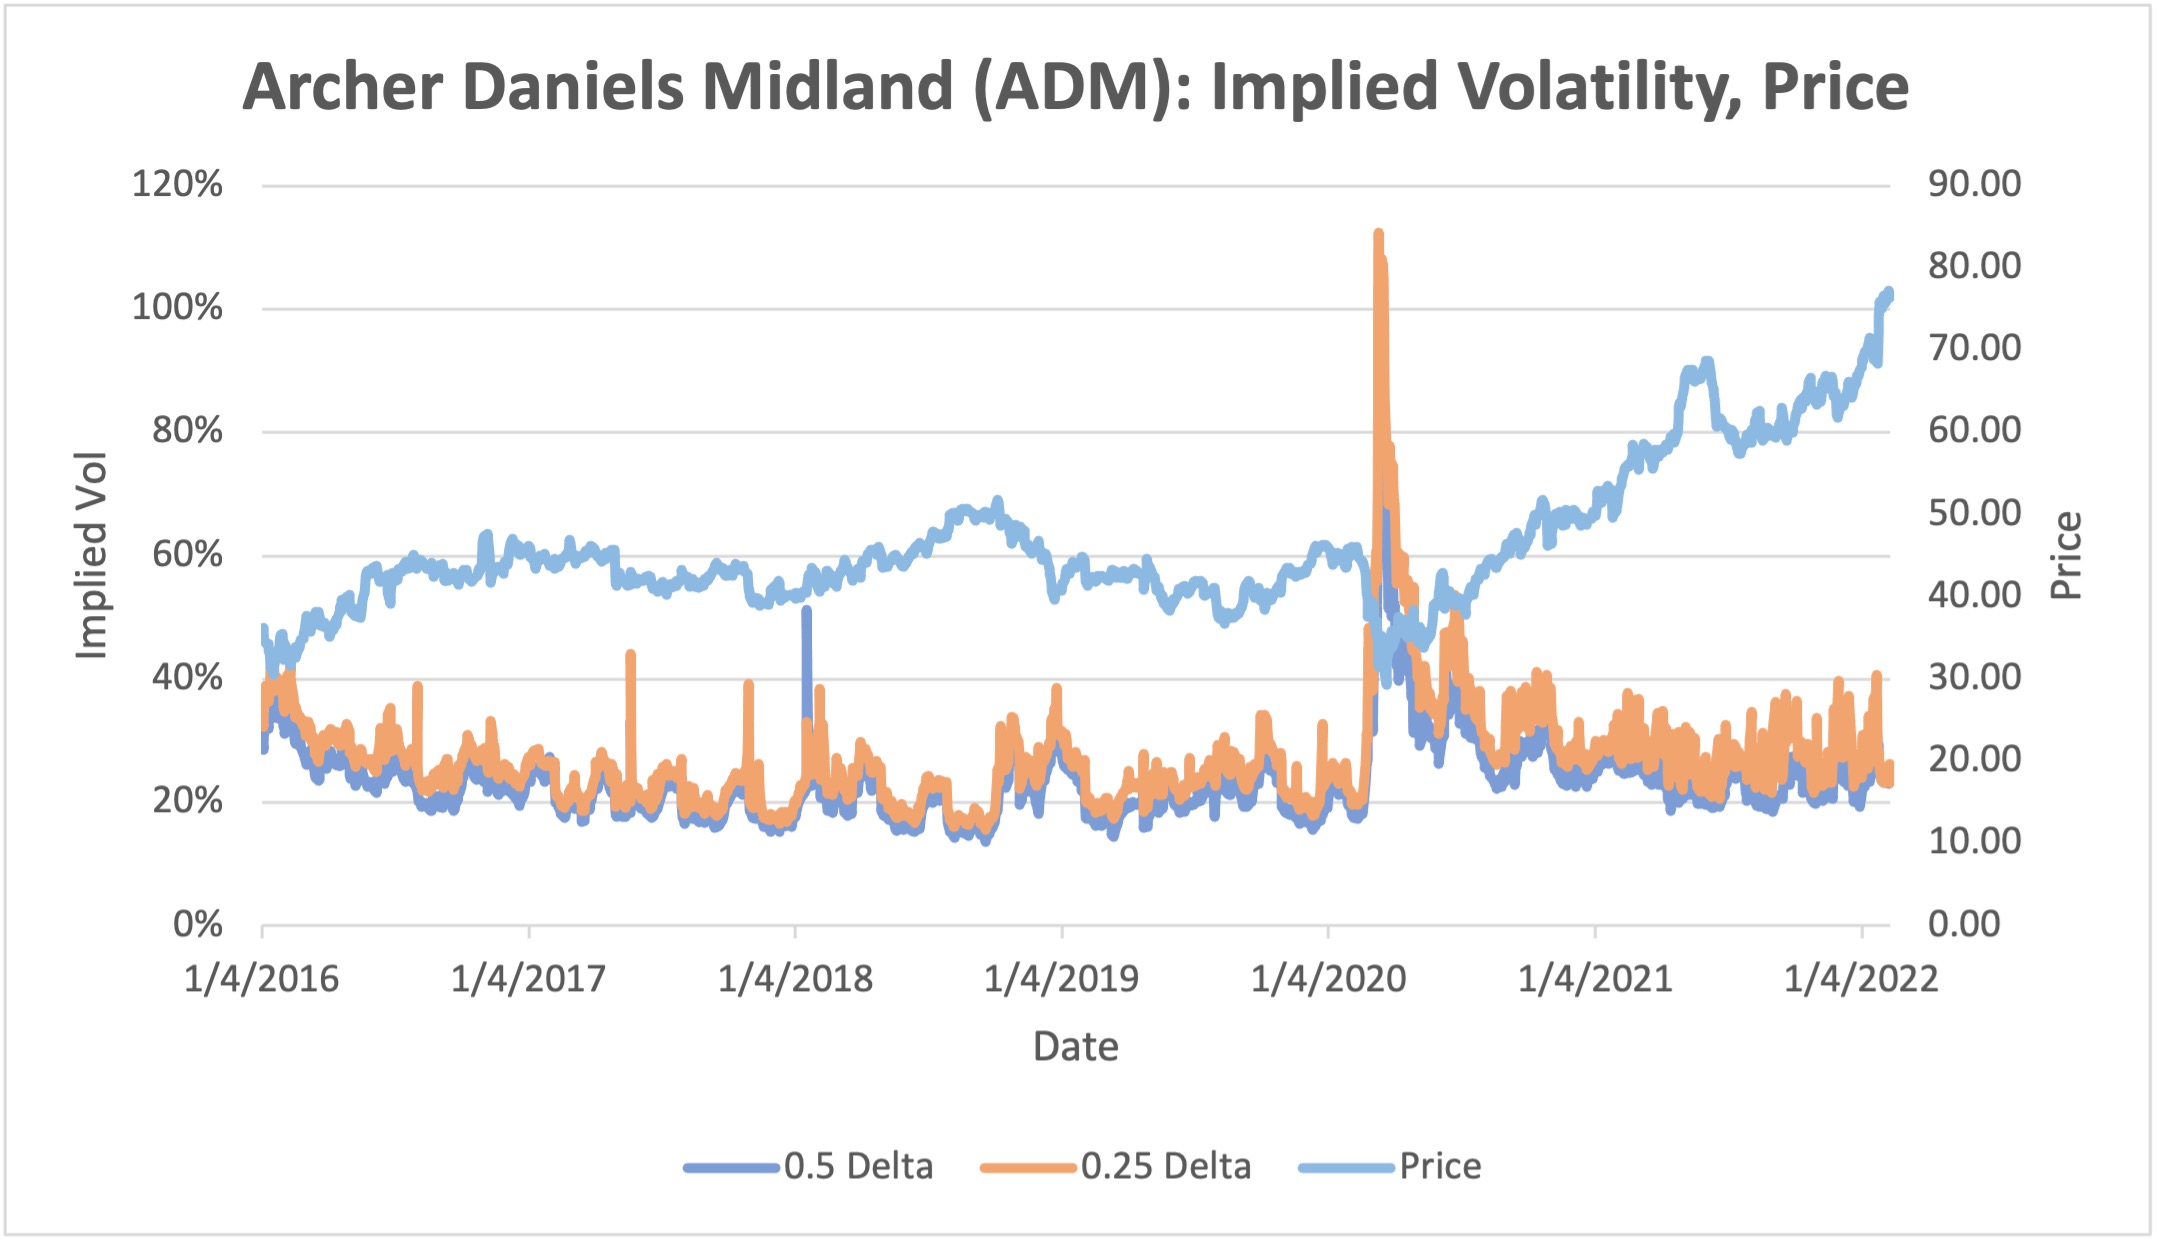
- So far, sectors that should benefit from Russia/Ukraine hostilities (defense, energy, select agriculture) have not shown a commensurate increase in implied volatility. This is also true among sectors that should suffer (travel, banks, airlines). If a real war does break out (as opposed to the current “hybrid war”), one would expect at least a temporary increase in volatility, regardless of price direction. If so, that would imply that current options prices on these stocks are relatively inexpensive on a volatility basis and that one might receive a volatility kicker if a shooting war or invasion occurs (see ADM, BG, BA, DAL, and RDSA charts below).
Top 10 Implied Volatility Rankings:
| Ranking | Name (Ticker) | Sector | Implied Volatility (%) | Implied Volatility, Absolute Change (%) | Historical Volatility (%) | Historical Volatility, Absolute Change (%) |
|---|---|---|---|---|---|---|
| 1 | GME | Meme | 116 | 2 | 98 | 9 |
| 2 | DASH | e-Commerce | 97 | 5 | 100 | 0 |
| 3 | PTON | Sports/Leisure | 91 | -35 | 174 | 34 |
| 4 | W | e-Commerce | 88 | -3 | 76 | 0 |
| 5 | PLTR | Software | 83 | -1 | 67 | 4 |
| 6 | ETSY | e-Commerce | 80 | -1 | 75 | 0 |
| 7 | MRNA | Pharmaceuticals | 78 | -1 | 68 | -4 |
| 8 | GPS | Apparel | 72 | 7 | 56 | 4 |
| 9 | ENPH | Energy | 69 | -20 | 82 | 14 |
| 10 | NVDA | Semi-conductors | 68 | 7 | 63 | 10 |
Interesting Charts of Note:
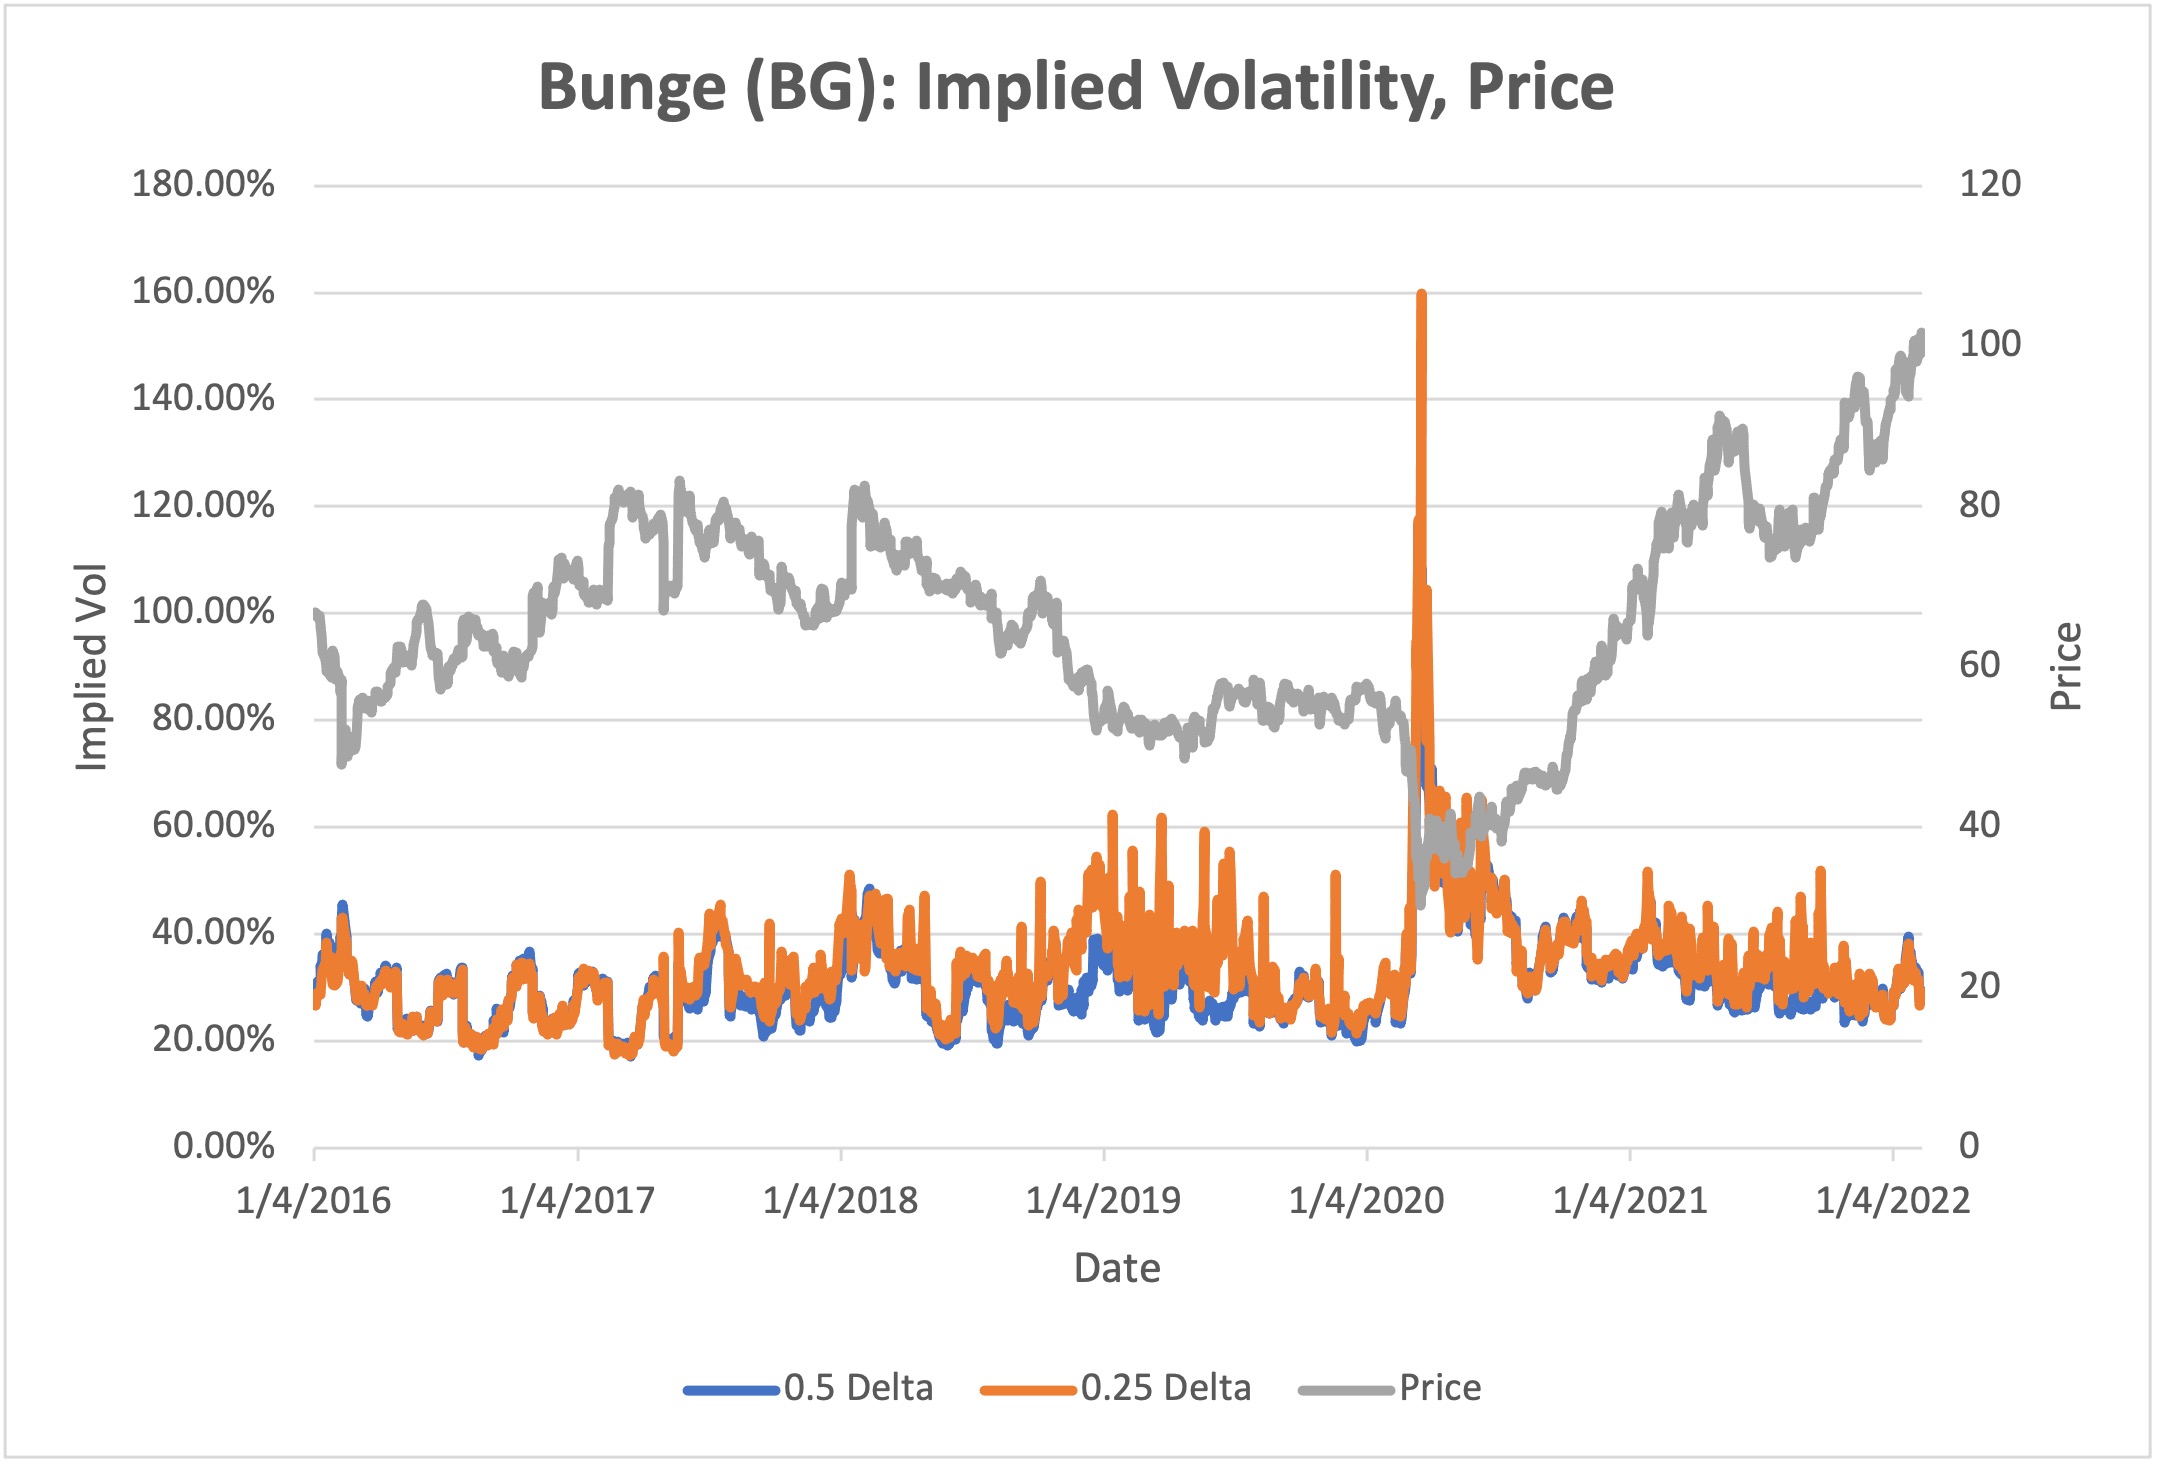
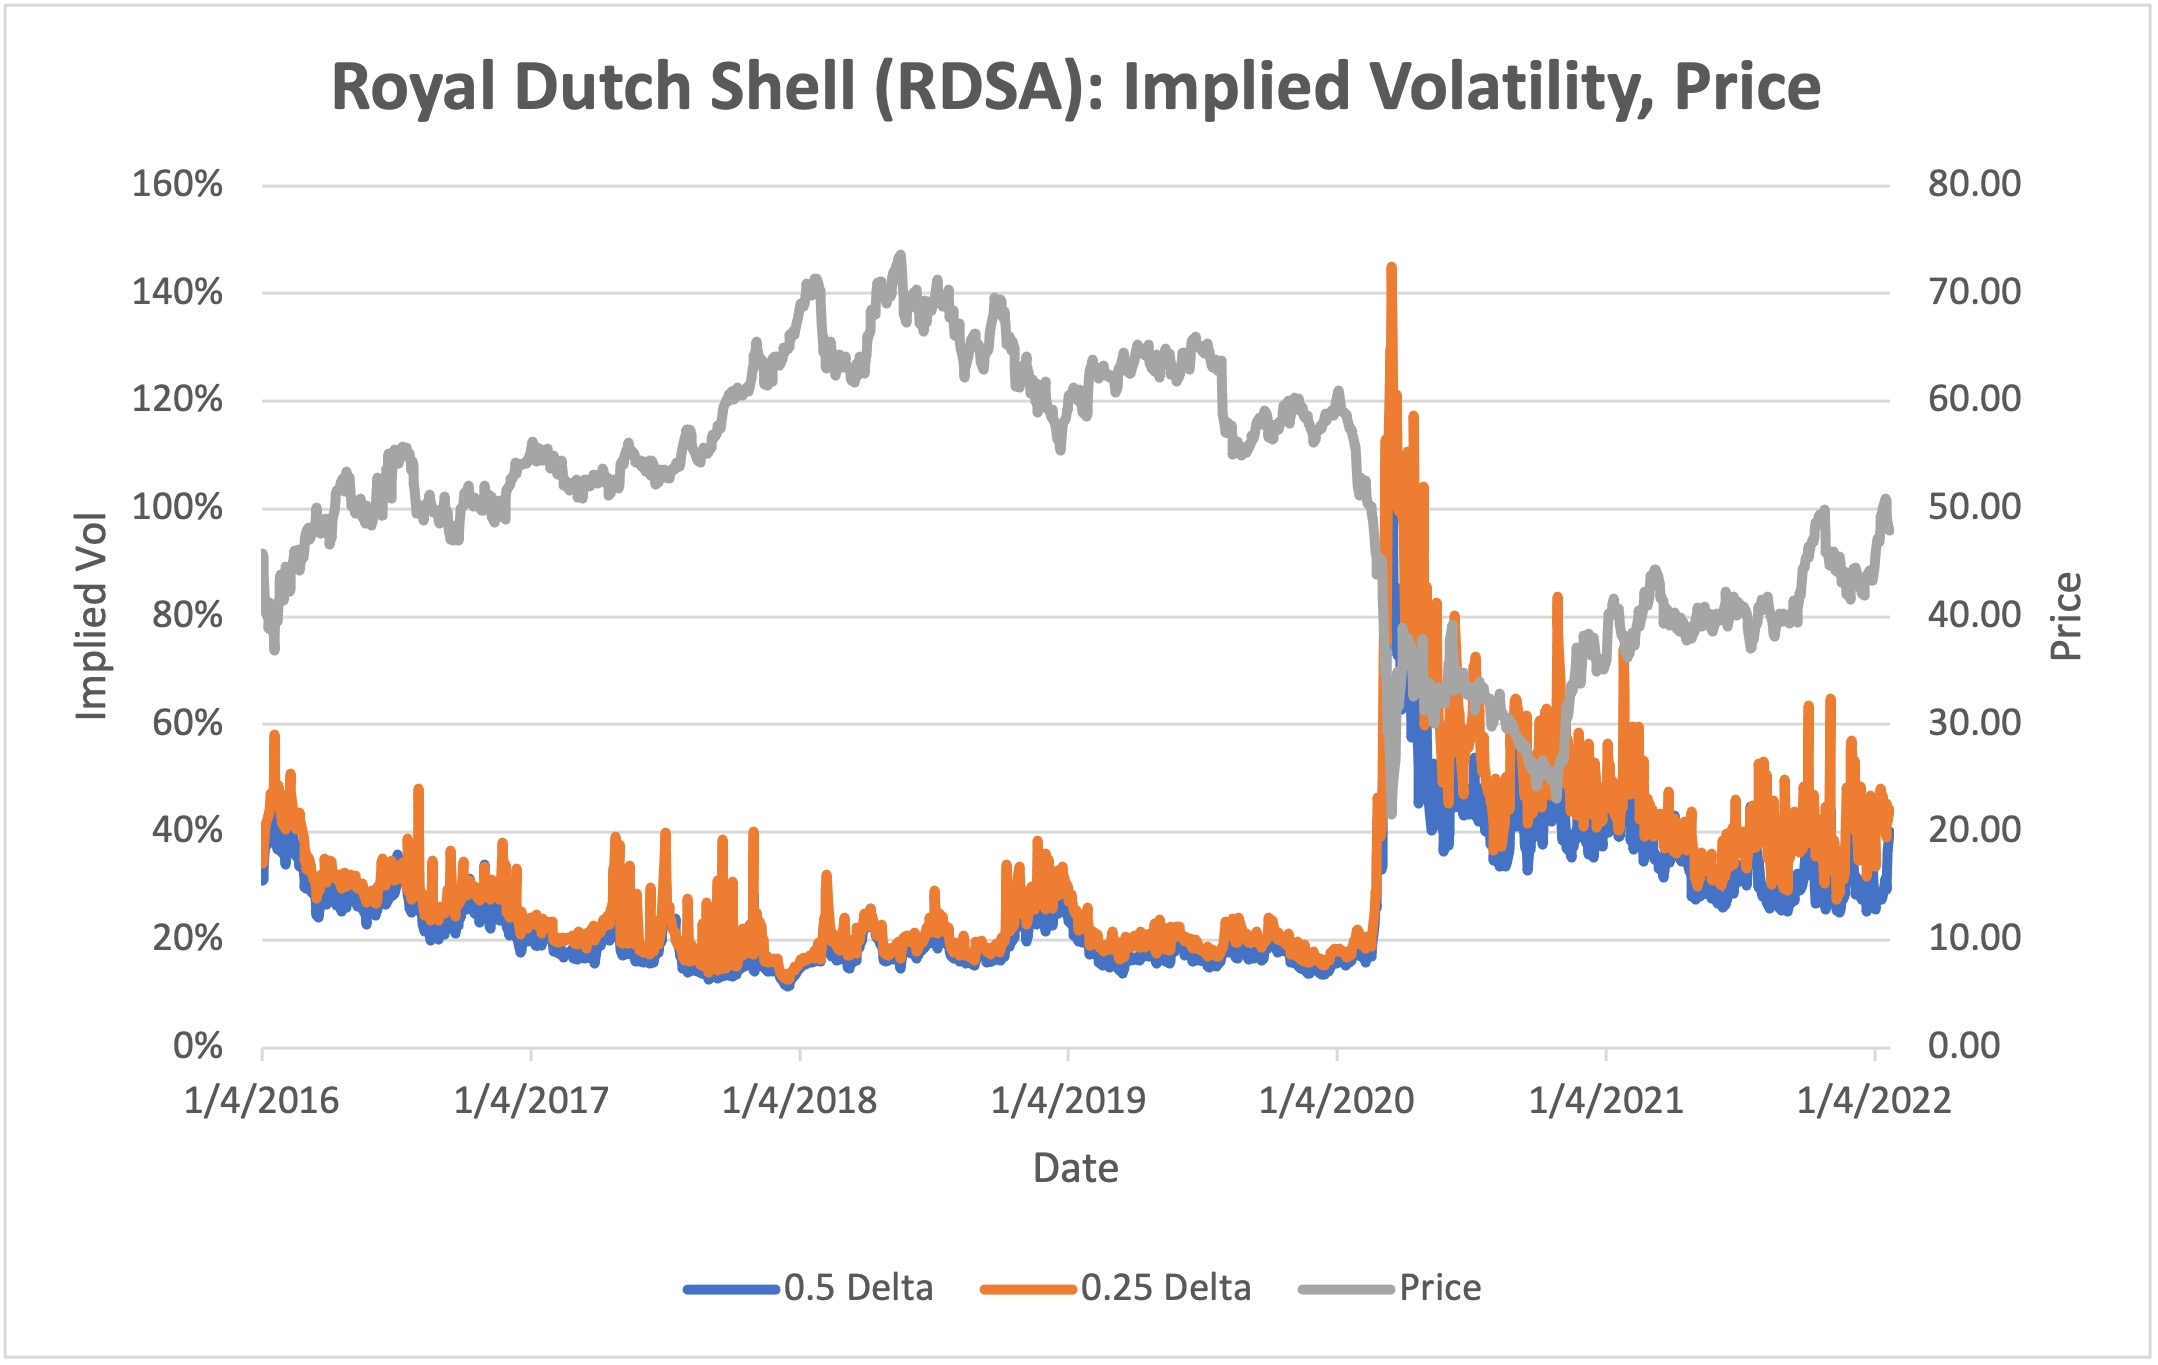
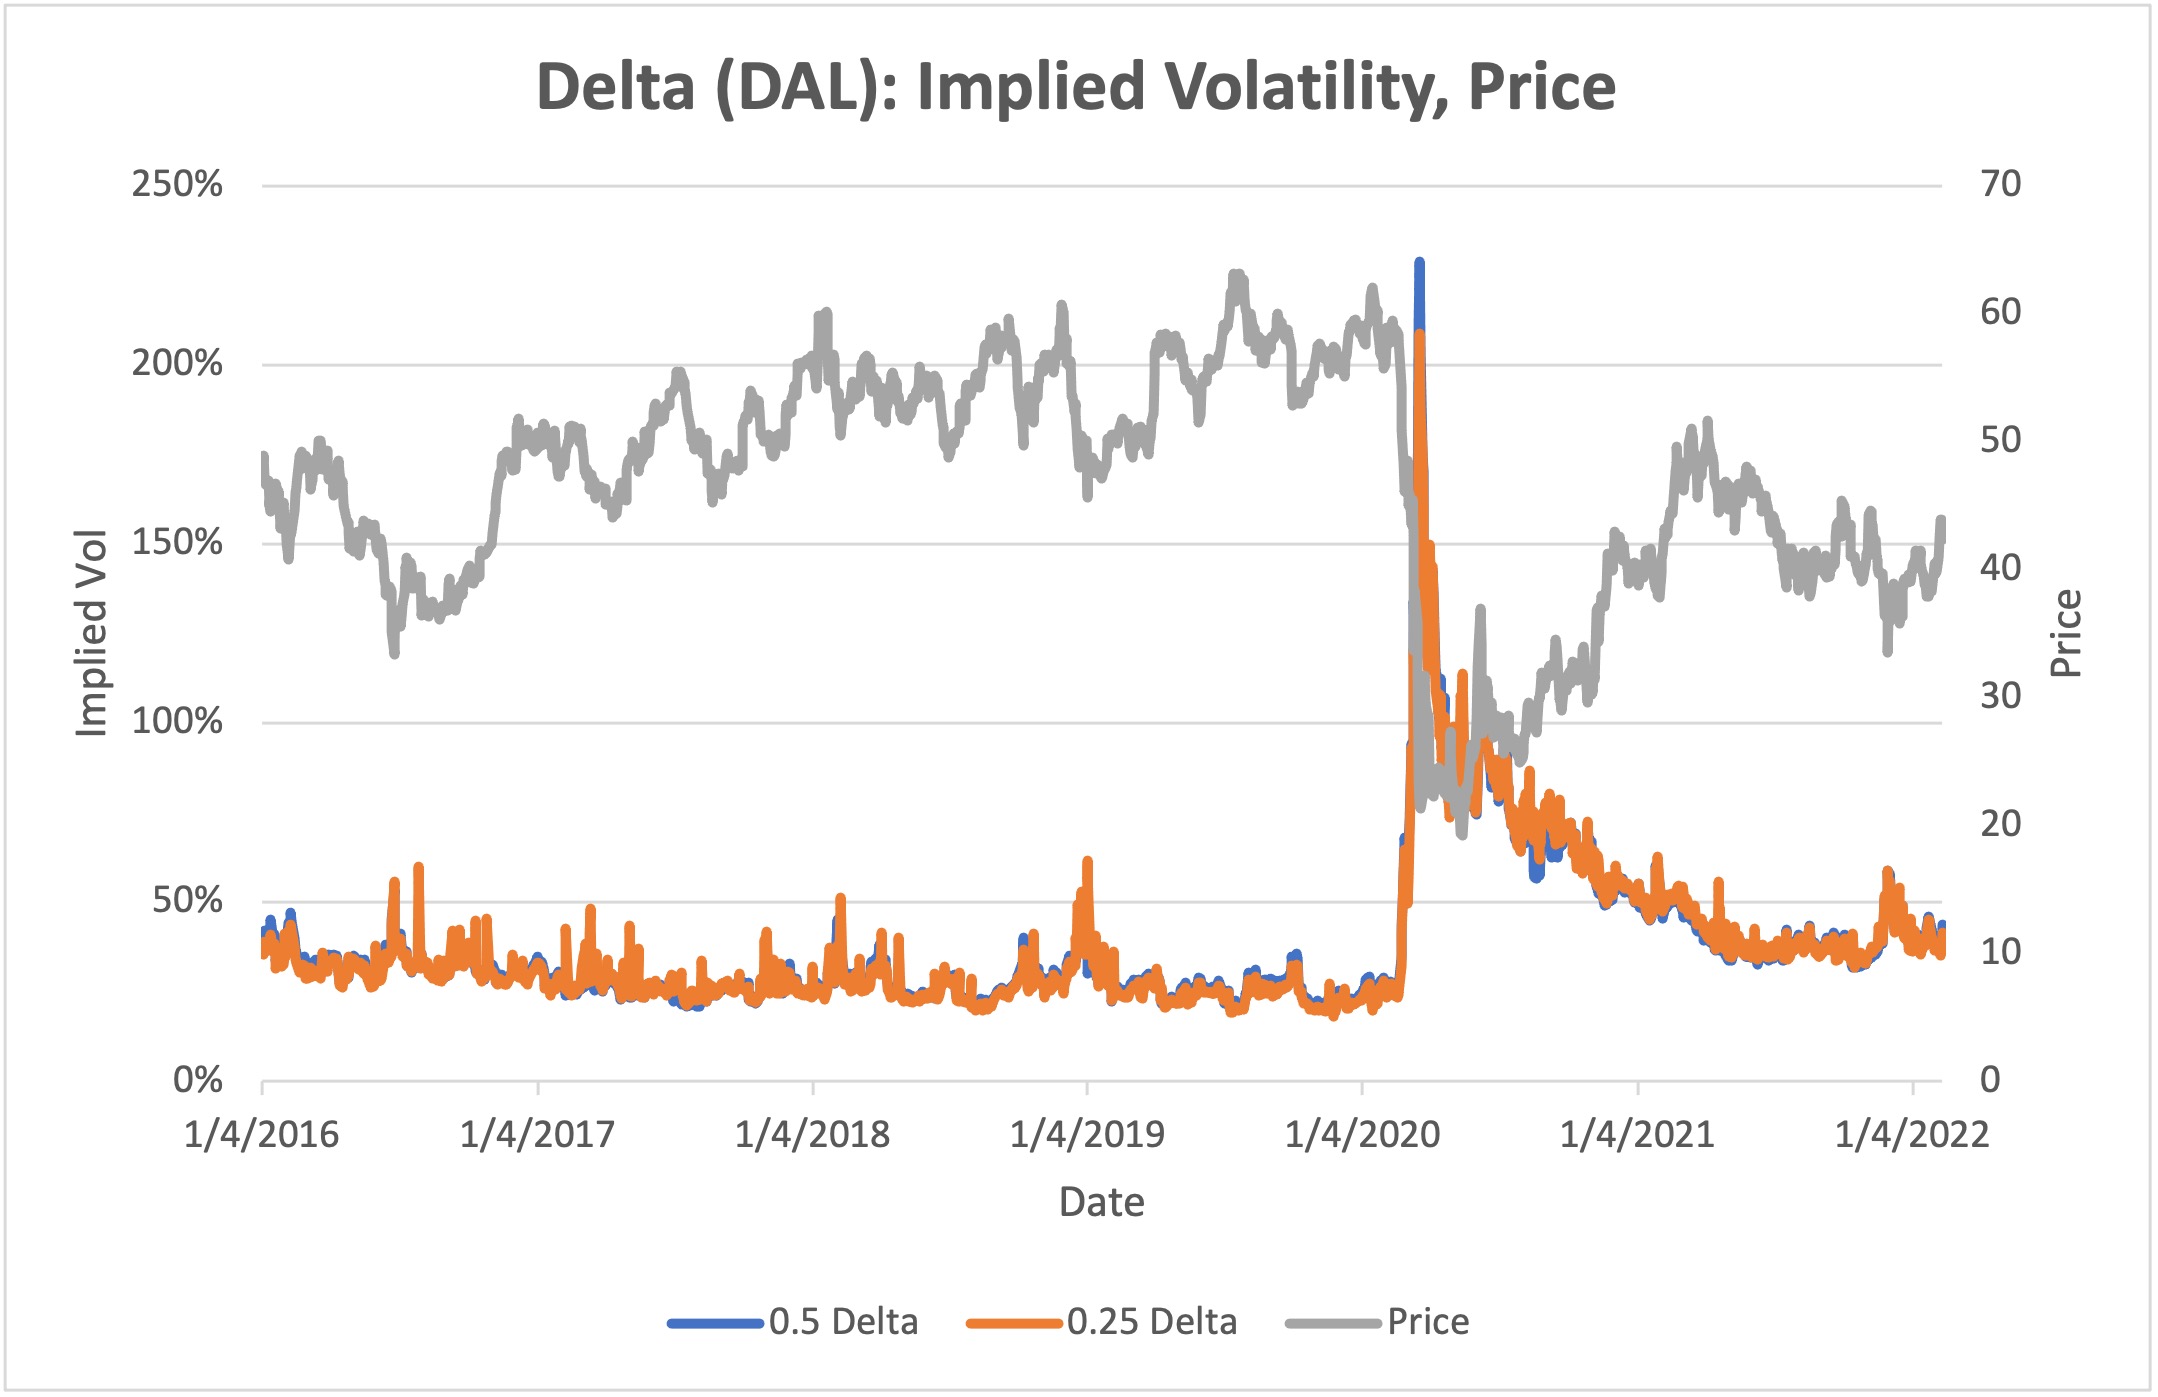
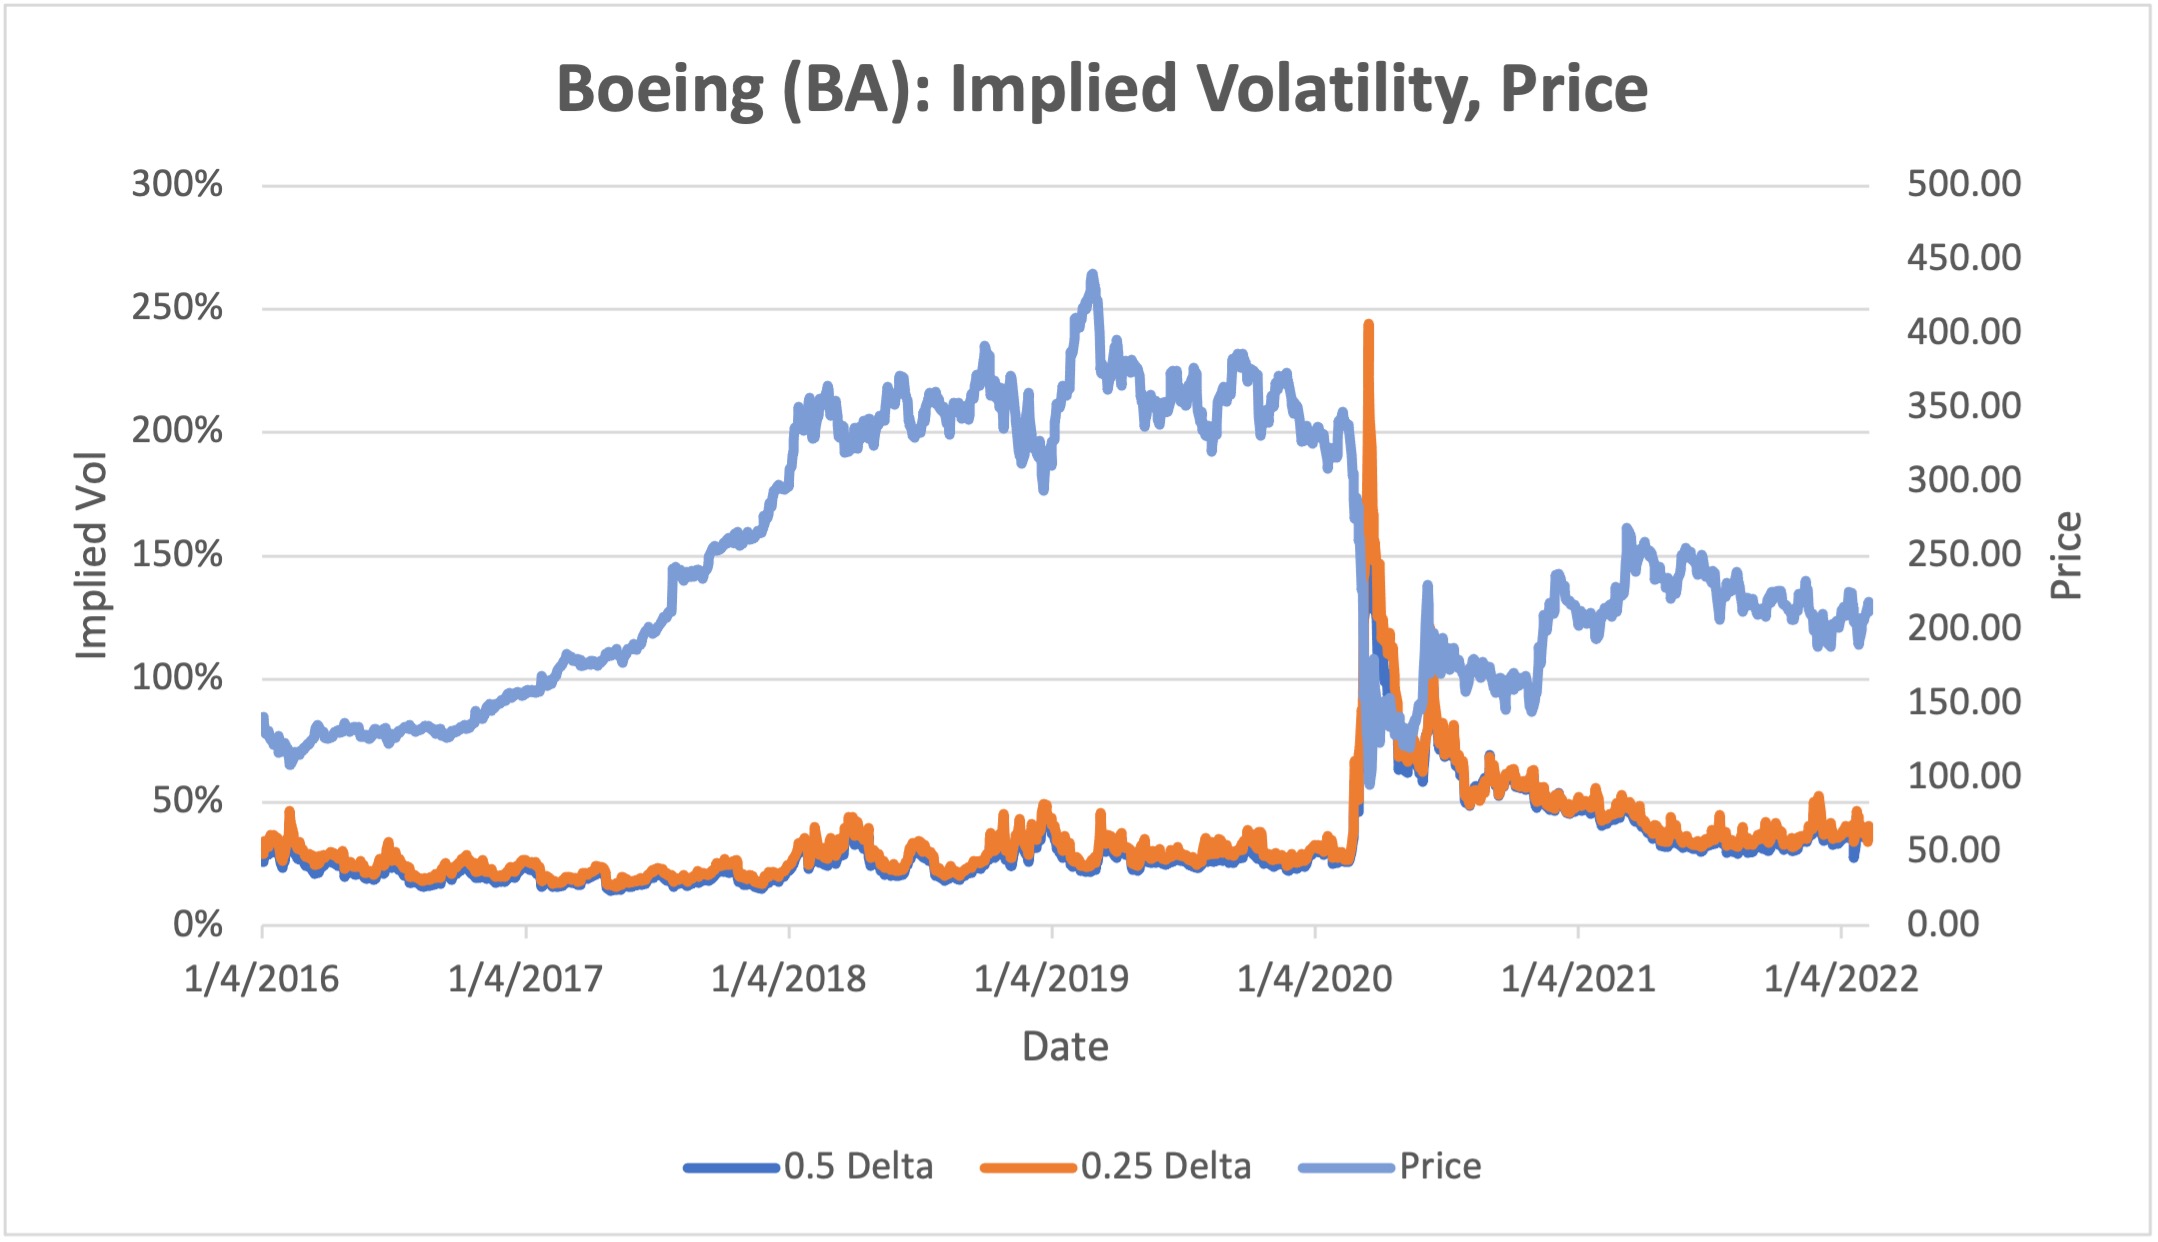
Methodology: Rankings include 500 of the largest public companies (by market cap) traded on the NYSE, NASDAQ, or CBOE. All changes are measured over the Friday/previous Friday period; all metrics are based on exchange-provided settlement prices. Implied volatilities represent a 30-day expiration and 0.5 delta, calculated using volatility surface methodologies provided by OptionMetrics.
Options involve a high degree of risk and are not suitable for all investors. OptionStrat is not a registered investment advisor. The calculations, information, and opinions on this site are for educational purposes only and do not constitute investment advice. Calculations are estimates and do not account for all market conditions and events.