ARK Just Ain’t What It Used to Be
Cathie Wood’s ARK Innovation ETF skyrocketed to mass popularity when it delivered a solid 35.7% return in 2019 and then followed up with an eyepopping 156.6% in 2020. She is now firmly enshrined as a Wall St. celebrity and commands an almost cult-like following with 1.4 million followers on Twitter (that’s high, but keep in mind that Elon Musk has over 94 million followers!). Her strategy, whether deliberate or not, was brilliant: combine social media with the market’s obsession for new and disruptive tech stocks. It worked — with glowing profiles in mainstream media, outsized returns, and a mix of high-flying growth stocks (Tesla, Square, Shopify, etc.), her flagship ARK Innovation ETF (ARKK) peaked out at $27.9 bn in 2021. She was in the right place at the right time and the new Queen of CNBC.
That was 2020, this is now. After a blazing 2020, 2021 returned a worrisome and negative 23.4%, that in a year in which the S & P returned a positive 27%. So far, 2022 has been a disaster, with ARKK down 55.1% ytd. Needless to say, investors have been rushing to the exits since late 2021 and ARKK is now down to $8.7 bn under management.
If you believe that Ms. Wood is down, but not out, then you should consider options on ARKK. They have excellent liquidity if you are thinking that the ETF will either recover or resume its downward trajectory.
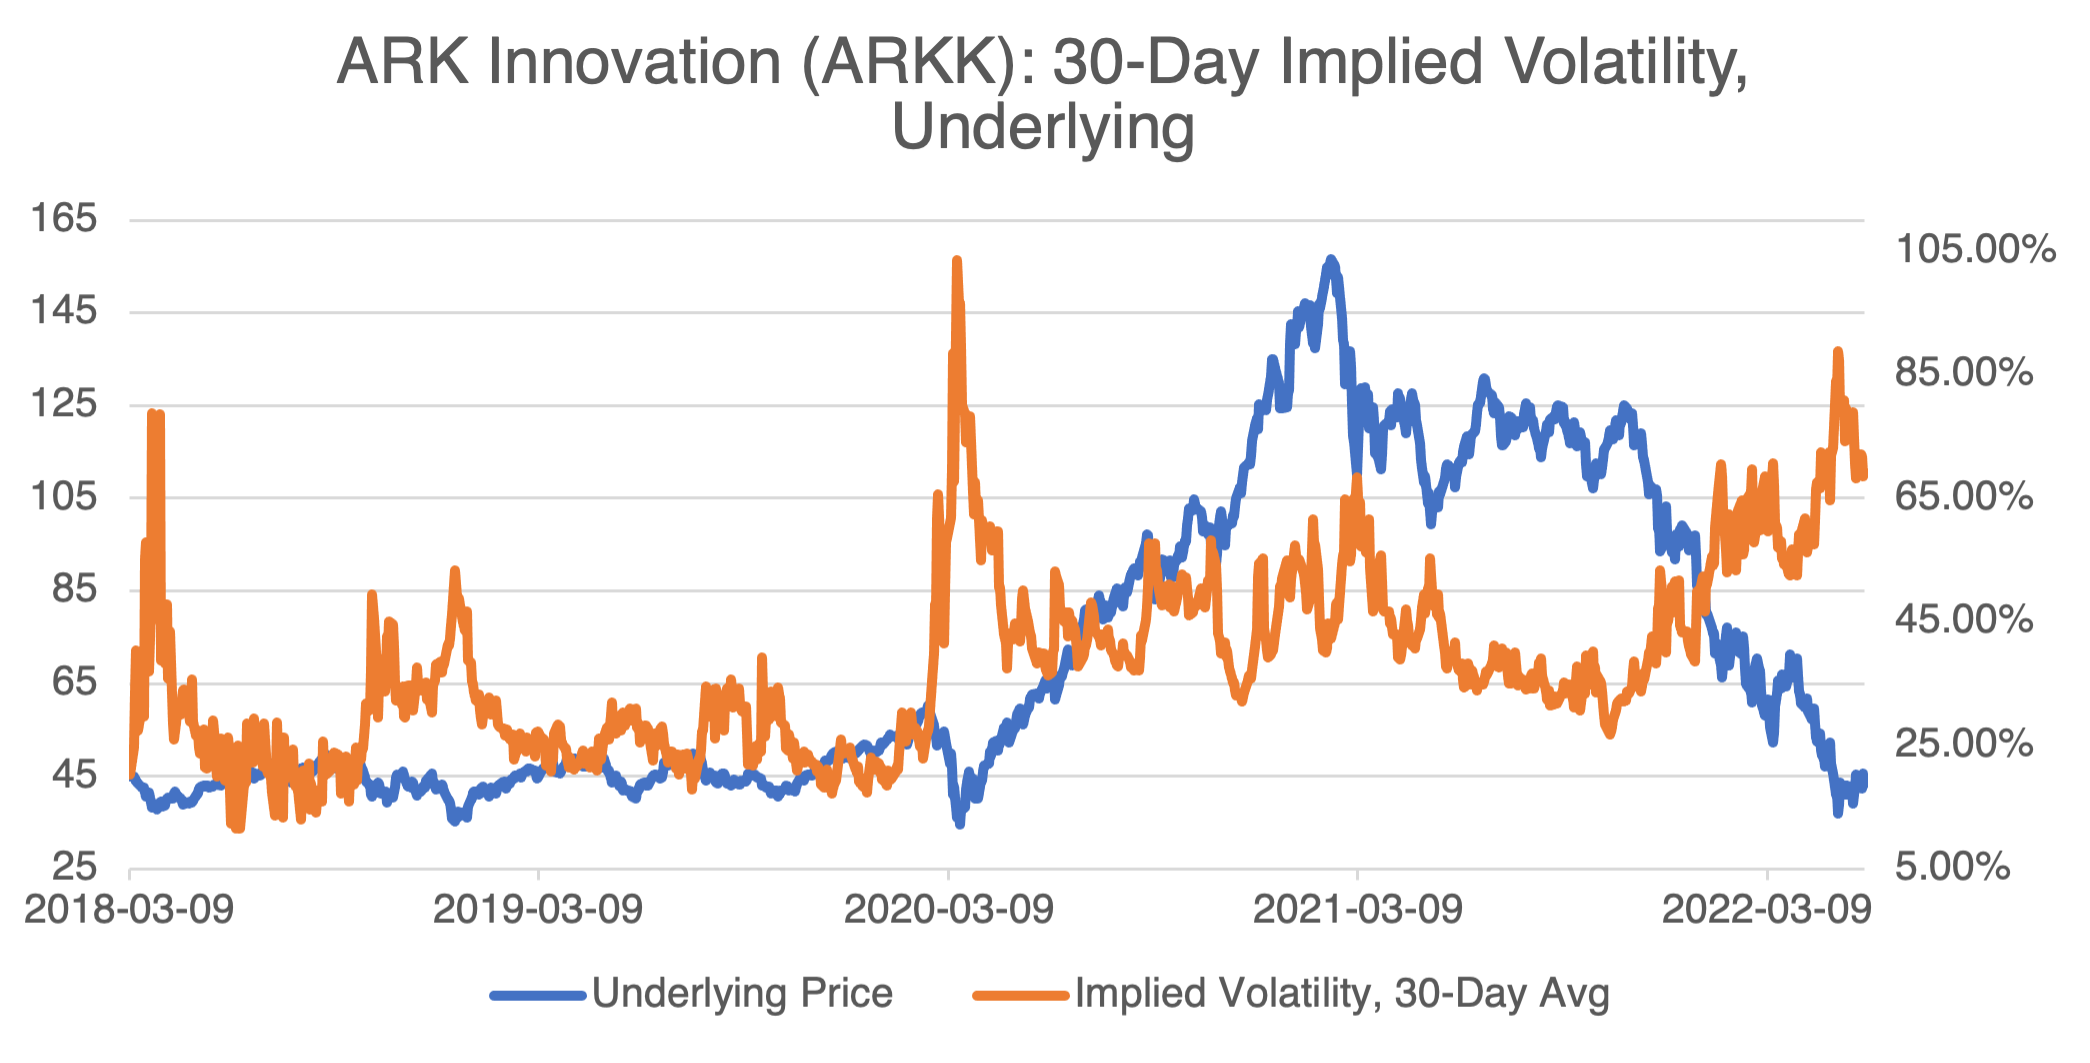
As always, whichever options strategy you choose must take into account implied volatility or you might be disappointed in the results. As you can see below, ARKK has sunk to roughly its pre-2020 levels, but its implied volatility has spiked to nearly 70%, 30% higher than its long term average. If ARKK stabilizes or rallies, its implied volatility will tend to decrease; on the other hand, if ARKK continues its downward push, implied volatility should continue its upward trajectory.
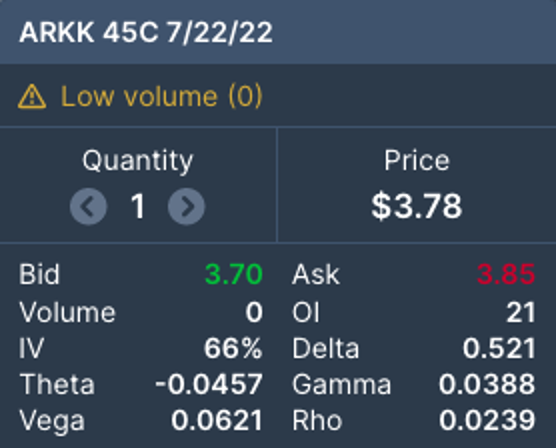
The effect of implied volatility, especially at elevated levels, should not be ignored. Let’s take a simple example to illustrate the effect, the ARKK July 22nd expiration $45.00 call (at-the-money). As of this writing, it’s offered at $3.85 with the stock trading $44.30 and with an implied volatility of 66% (see below from OptionStrat).

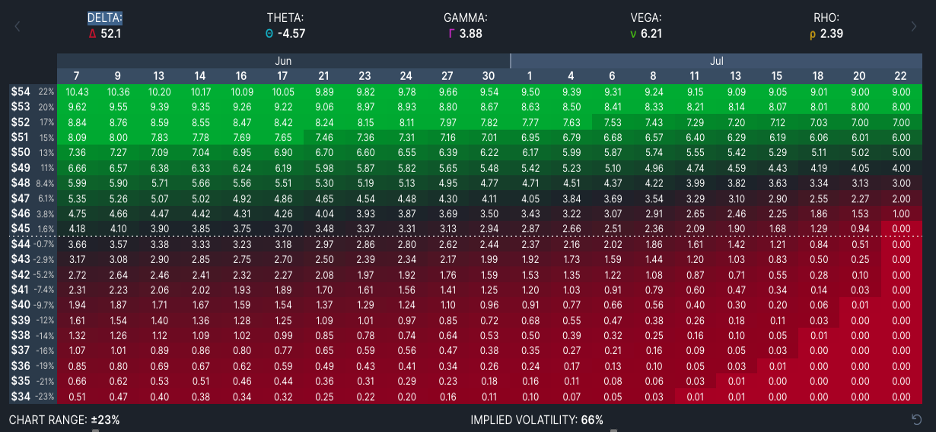
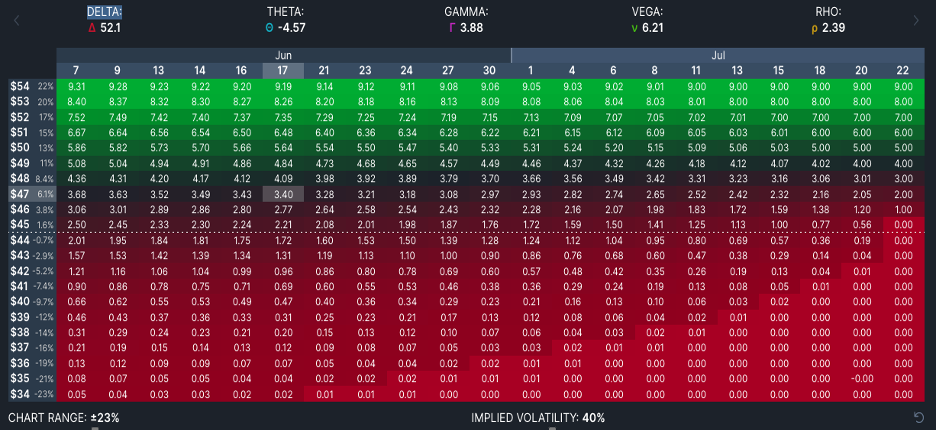
Now, let’s see what happens to the premium if implied volatility is at 40%, which is about ARKK’s long term average. In that case, the $45.00 call would be worth about $2.50, a 35% loss. Of course, that’s not going to happen in one day. The charts below from OptionStrat allow you to simulate the premium ($/contract) at two different volatility levels (66% and 40%) as time and prices vary:


As you can see, as long as prices do not go deep in-the-money, the effect of time and lower volatility can significantly decrease the call’s return if prices go sideways to moderately higher. Using the previous example (07/22 45.00 Call @ $3.85), let’s evaluate 5 scenarios, all about one month from now on 07/06:
|
ARKK Price |
IV = 40% |
IV = 60% |
||
|
Premium |
Return |
Premium |
Return |
|
|
54 |
9.02 |
134% |
9.31 |
142% |
|
50 |
5.2 |
35% |
5.87 |
52% |
|
45 |
1.5 |
-61% |
2.51 |
-35% |
|
40 |
0.13 |
-97% |
0.66 |
-83% |
|
36 |
0 |
-100% |
0.13 |
-97% |
The effect of implied volatility, as well as the other Greeks, is maximized at-the-money. This is reflected in the return figures above. Comparing the two volatility scenarios, notice that if the $45.00 call goes deep in-the-money at $54, the return is only marginally effected by lower volatility. On the other hand, if ARKK tends to be just a few dollars at or in-the-money (i.e., conditions perfect for a decrease in volatility), then volatility becomes a significant factor.