Volatility Effects of the Russia/Ukraine Situation
- As we have written over the last several weeks, the Russia/Ukraine situation may produce some opportunities in options trading that don’t come along too often. Luckily, and despite the best efforts of various sociopathic and monomaniacal world leaders, shooting wars with long-lasting global ramifications are relatively rare. Although Putin seems to be giving it his best shot by semi-invading eastern Ukraine, it’s still too early to tell whether this conflict will qualify.
- Regardless, we can surely say that the uncertainty surrounding the situation has increased, as should the implied volatility of affected stocks, sectors, and related indexes. As previous conflicts that grew into global events (e.g., Gulf Wars I and II) have shown, implied volatility can fluctuate wildly as the probability of a resolution changes.
- If this metastasizes into a real shooting war that provokes a military response from Western forces (i.e., NATO), the effects on implied volatility will be very significant. This will not only affect the absolute levels of volatility, but also its skew, or the difference between out-of-the money and in-the-money implied volatilities. Increased uncertainty increases skew, as does increased demand for out-ot-the-money strikes as they become more probable.
- Extreme, commodity-like volatility levels and swings are then possible, and it will become difficult to predict option valuation or assign greeks. Interesting options nerd fact #1: When volatility reaches extreme values, option greeks display strange behavior. For example, in the neighborhood of 100% volatility, most deltas peg out at 0.5, regardless of strike. This makes sense since at super high volatility levels all outcomes and strikes are suddenly possible. Interesting options nerd fact #2: it’s possible for volatility to increase or decrease so much that it temporarily swamps the effect of movements in the underlying. You could then get the perverse situation of puts increasing in value as the market increases, or vice versa for calls. Although super rare, this actually occurred during the run-up to the two Gulf Wars.
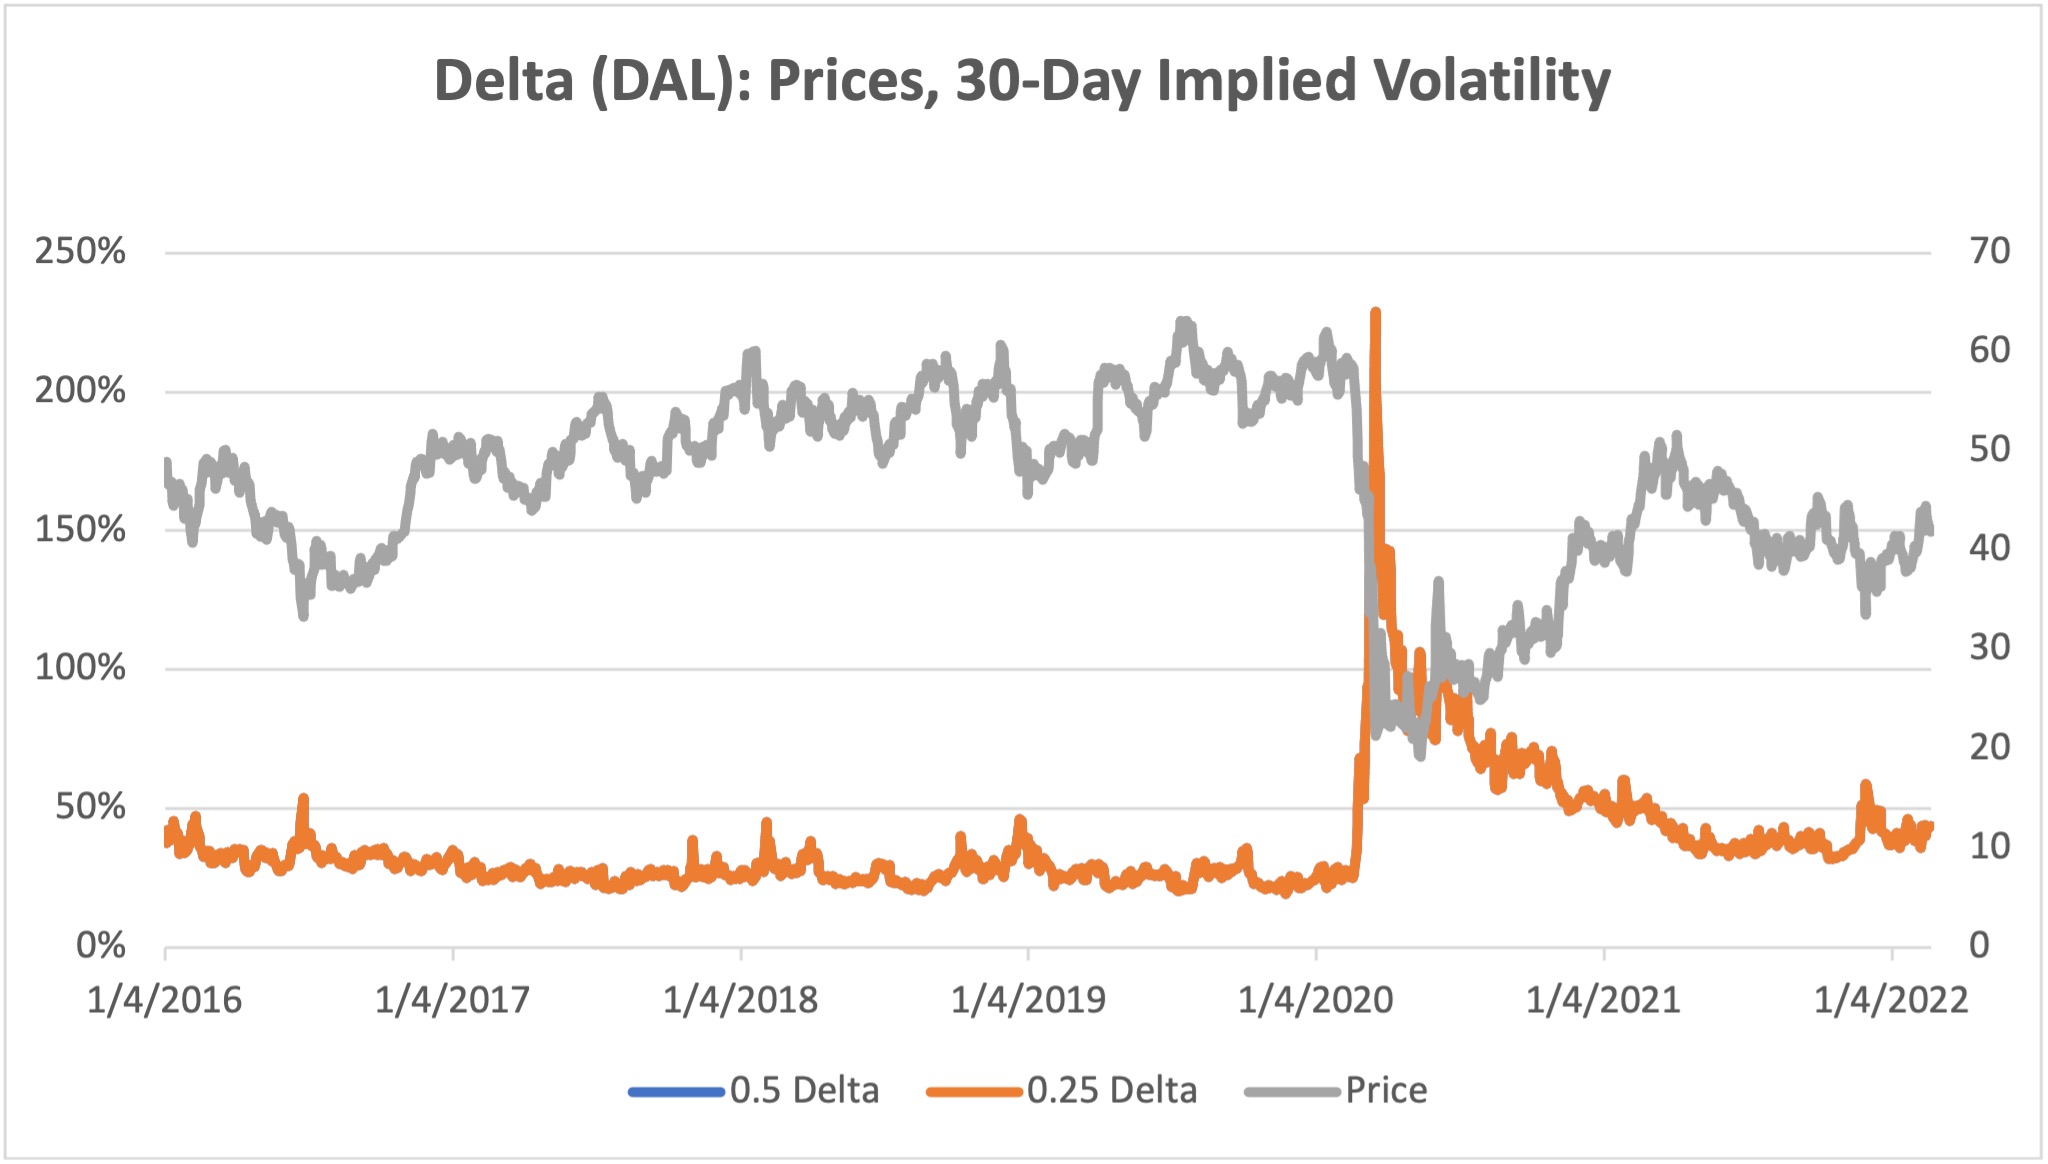
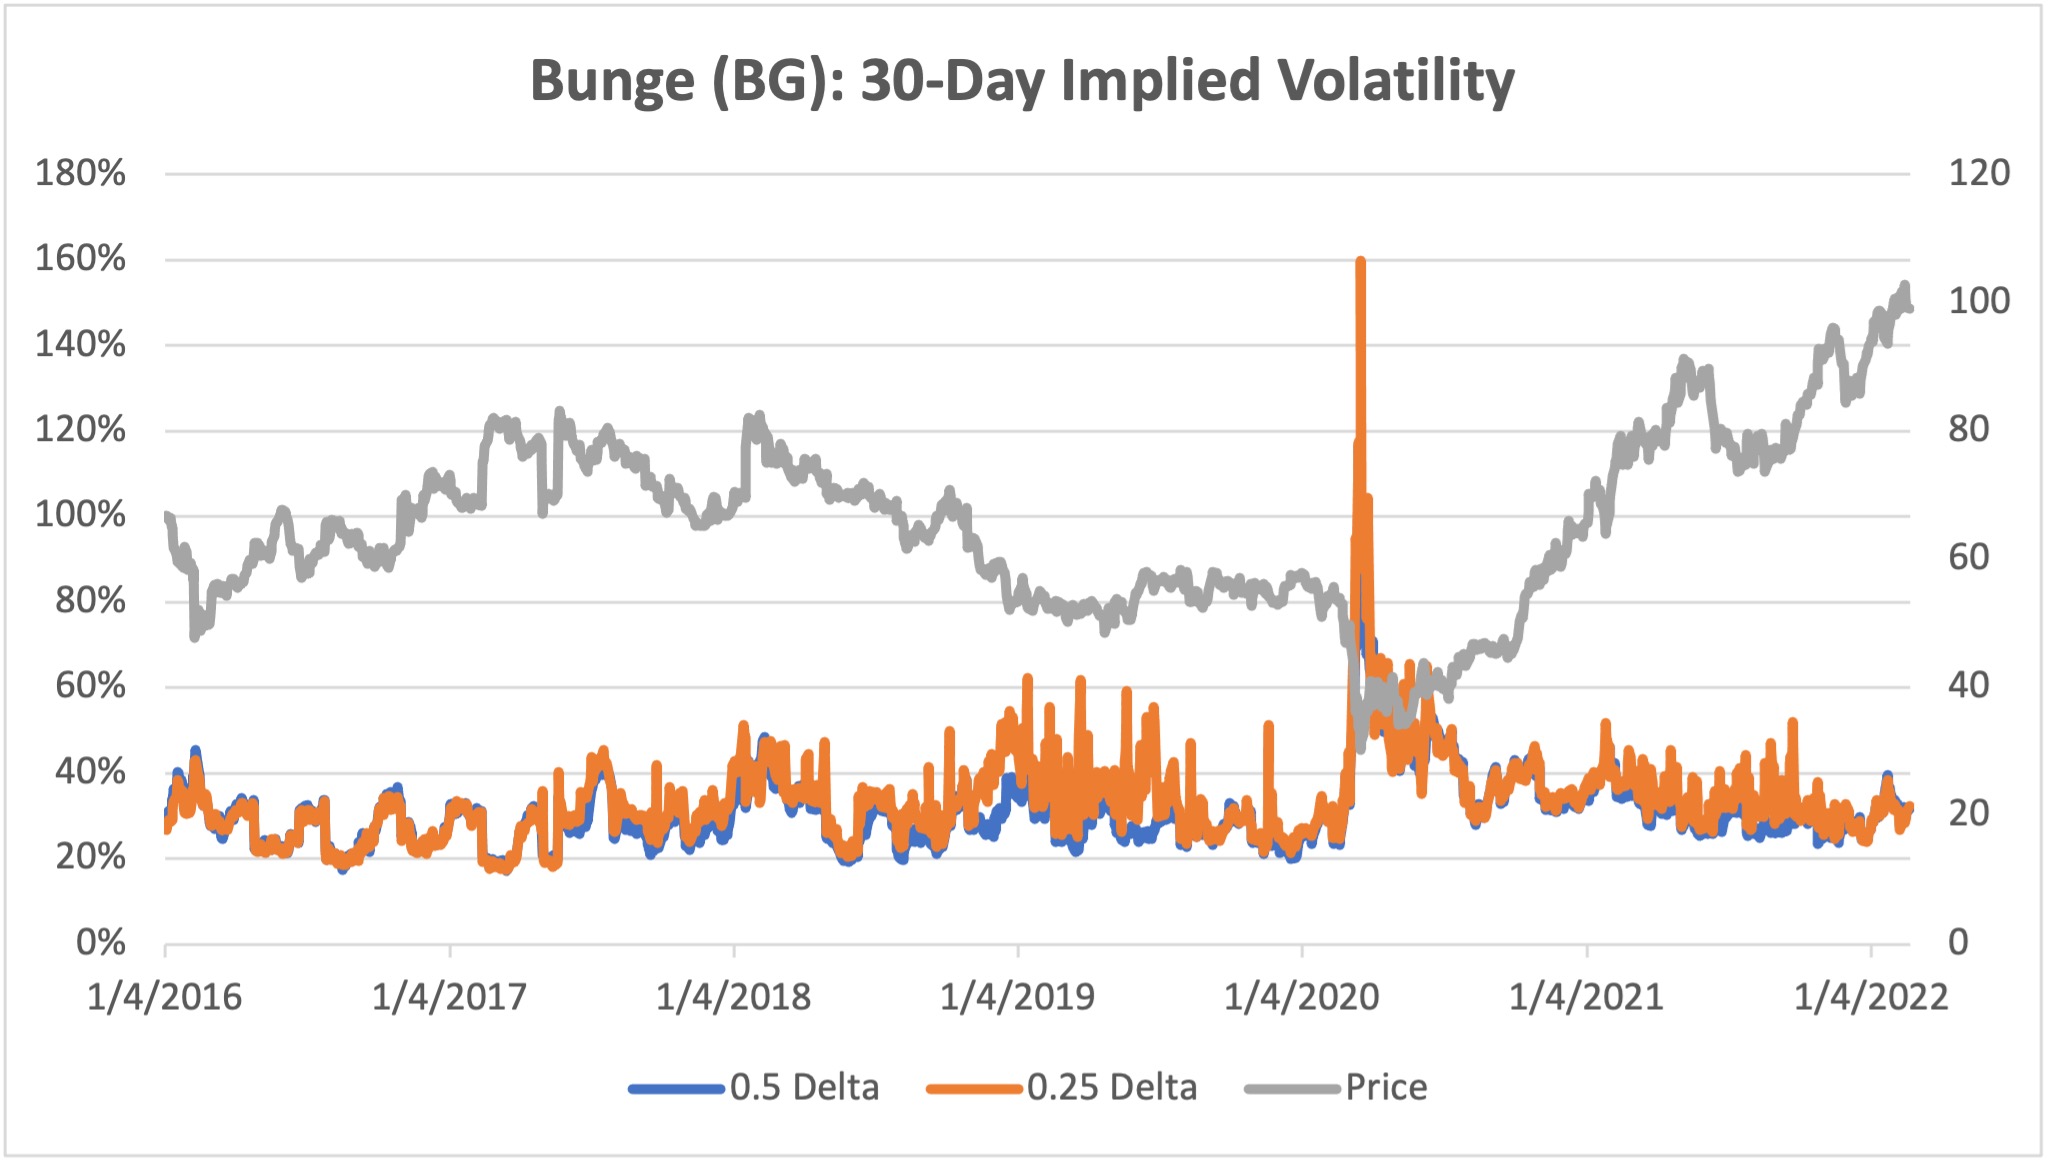
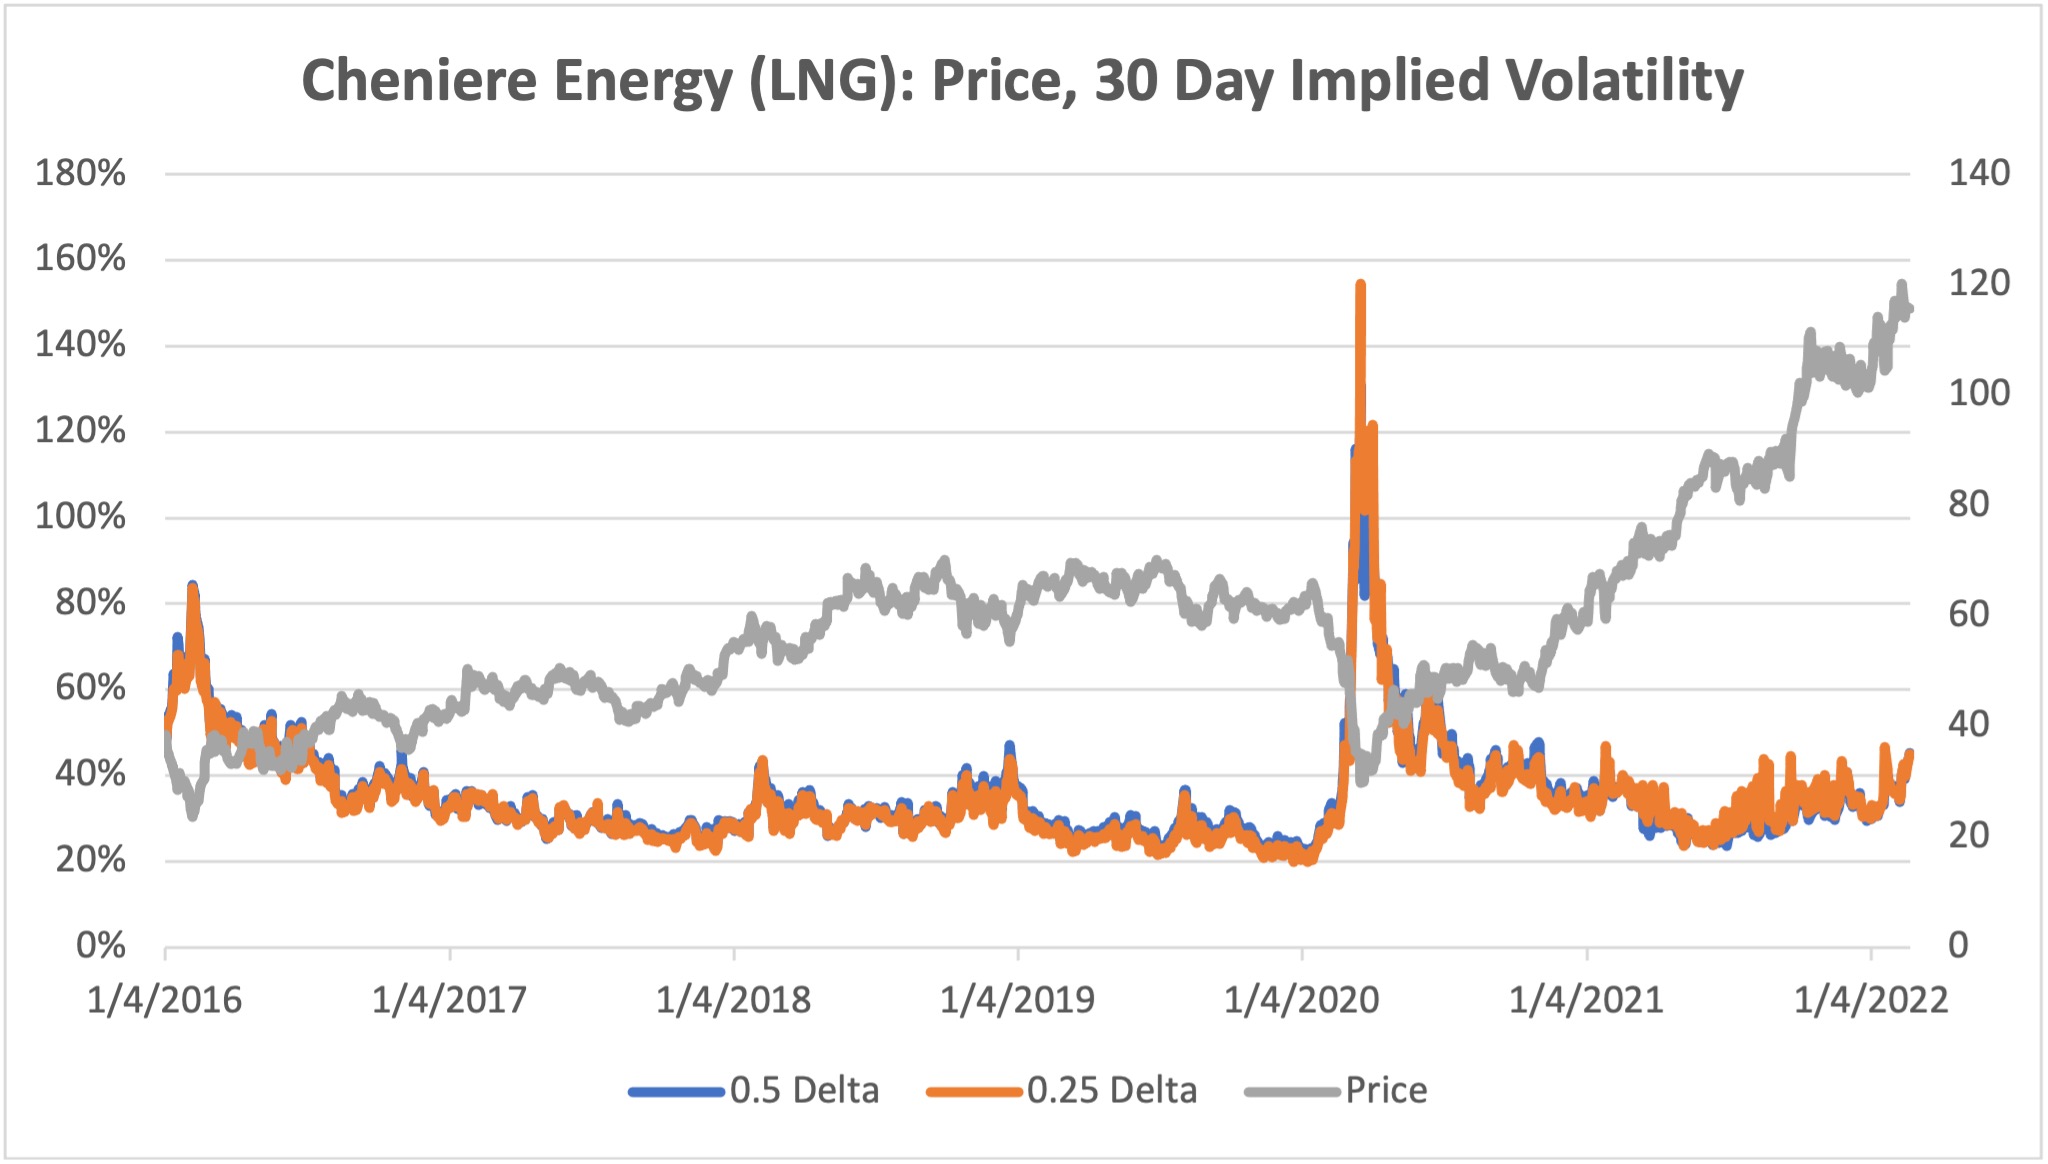
- Below the week’s top 10 volatility rankings are charts of some representative equities whose prices and implied volatilities could be negatively (Delta) or positively (Cheniere, Bunge) impacted by serious hostilities. Of particular note is Cheniere Energy, a major US producer of LNG. Although its price continues to make new highs, its implied volatility has not yet broken out to the upside. If you believe that the Russian/Ukraine situation can only intensify, then options on LNG should be considered undervalued on a volatility basis.
Top 10 Implied Volatility Rankings
Week Ending: 02/18/2022
| Ranking | Name (Ticker) | Sector | Implied Volatility (%) | Implied Volatility, Absolute Change (%) | Historical Volatility (%) | Historical Volatility, Absolute Change (%) |
|---|---|---|---|---|---|---|
| 1 | GME | Meme | 116.6 | 0.7 | 96.6 | -1.8 |
| 2 | W | e-Commerce | 97.2 | 9.6 | 79.0 | 2.7 |
| 3 | ETSY | e-Commerce | 88.1 | 8.0 | 76.7 | 1.9 |
| 4 | PTON | Sports/Leisure | 84.7 | -6.3 | 169.2 | -4.9 |
| 5 | MRNA | Pharmaceuticals | 84.6 | 6.5 | 72.2 | 3.8 |
| 6 | DASH | e-Commerce | 79.8 | -17.2 | 110.5 | 11.0 |
| 7 | PLTR | Software | 79.7 | -3.1 | 89.3 | 22.0 |
| 8 | GPS | Apparel | 74.6 | 2.1 | 51.7 | -4.4 |
| 9 | ENPH | Energy | 67 | -1.8 | 84.2 | 1.9 |
| 10 | NCLH | Cruise Line | 65.2 | -0.9 | 65.9 | 1.4 |
Interesting Charts of Note:


Methodology: Rankings include 500 of the largest public companies (by market cap) traded on the NYSE, NASDAQ, or CBOE. All changes are measured over the Friday/previous Friday period; all metrics are based on exchange-provided settlement prices. Implied volatilities represent a 30-day expiration and 0.5 delta, calculated using volatility surface methodologies provided by OptionMetrics.
Options involve a high degree of risk and are not suitable for all investors. OptionStrat is not a registered investment advisor. The calculations, information, and opinions on this site are for educational purposes only and do not constitute investment advice. Calculations are estimates and do not account for all market conditions and events.