Gold Bugs and the Debt Boogeyman
Traders generally fall into one of four categories on Wall St: equity, bonds, foreign exchange, or commodities. Sure, there is some crossover, but that’s about it. I’m a commodity guy and have been for most of my career. I follow stocks and bonds and the dollar, but I’m most at home when talking about stuff that you can burn, eat, or make other stuff out of. That includes two commodities that have been the source of endless fascination for thousands of years, gold and silver (or, as commodity people call them, precious metals).
Gold and silver bugs tend to follow the metal with an almost messianic fervor, convinced that either the End is near or that our currency is being debased. In that sense, they have a lot in common with the original crypto evangelists. In the real world, gold tends to respond to political instability, inflation, or currency crises, but usually not to the extent prophesized. Gold’s last great rally was after the financial crisis and lasted from July 2010 to August 2011, eventually peaking at a little over $1900. A less significant rally occurred in the first half of 2020, this time peaking over $2,000. The war in Ukraine brought renewed interest, but the rally was short-lived, and gold has mostly languished since then. That is, until last October, when resurgent inflation and interest rate fears (“it’s the new ’70s!”) pushed traders back into the metal and over 18% higher. Gold bugs are once again dreaming of decisively breaking the $2,000 barrier. Hope springs eternal!
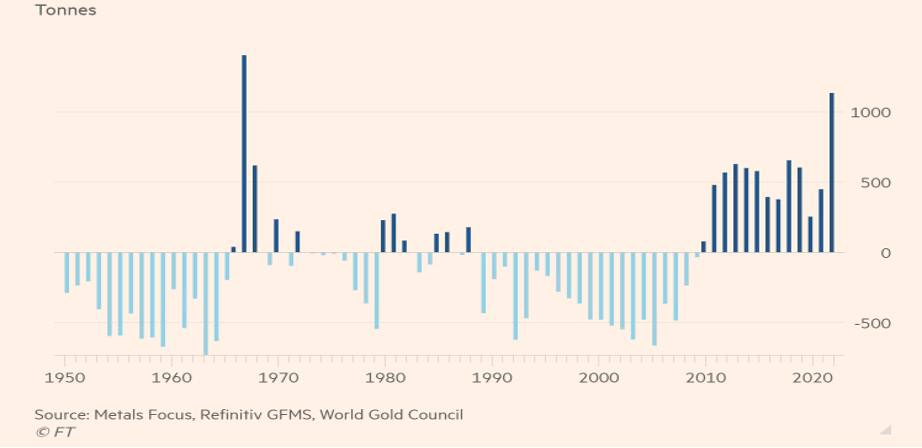
Personally, I’m skeptical. Below are central bank gold purchases since 1950. As you can see, purchases in 2022 were the highest since 1967, allegedly spurred on by governments in Turkey, the Mideast, China, and Russia worried about western sanctions related to the Ukrainian war. Whether these purchases, and their positive effect on gold, will continue into 2023 is anyone’s guess.

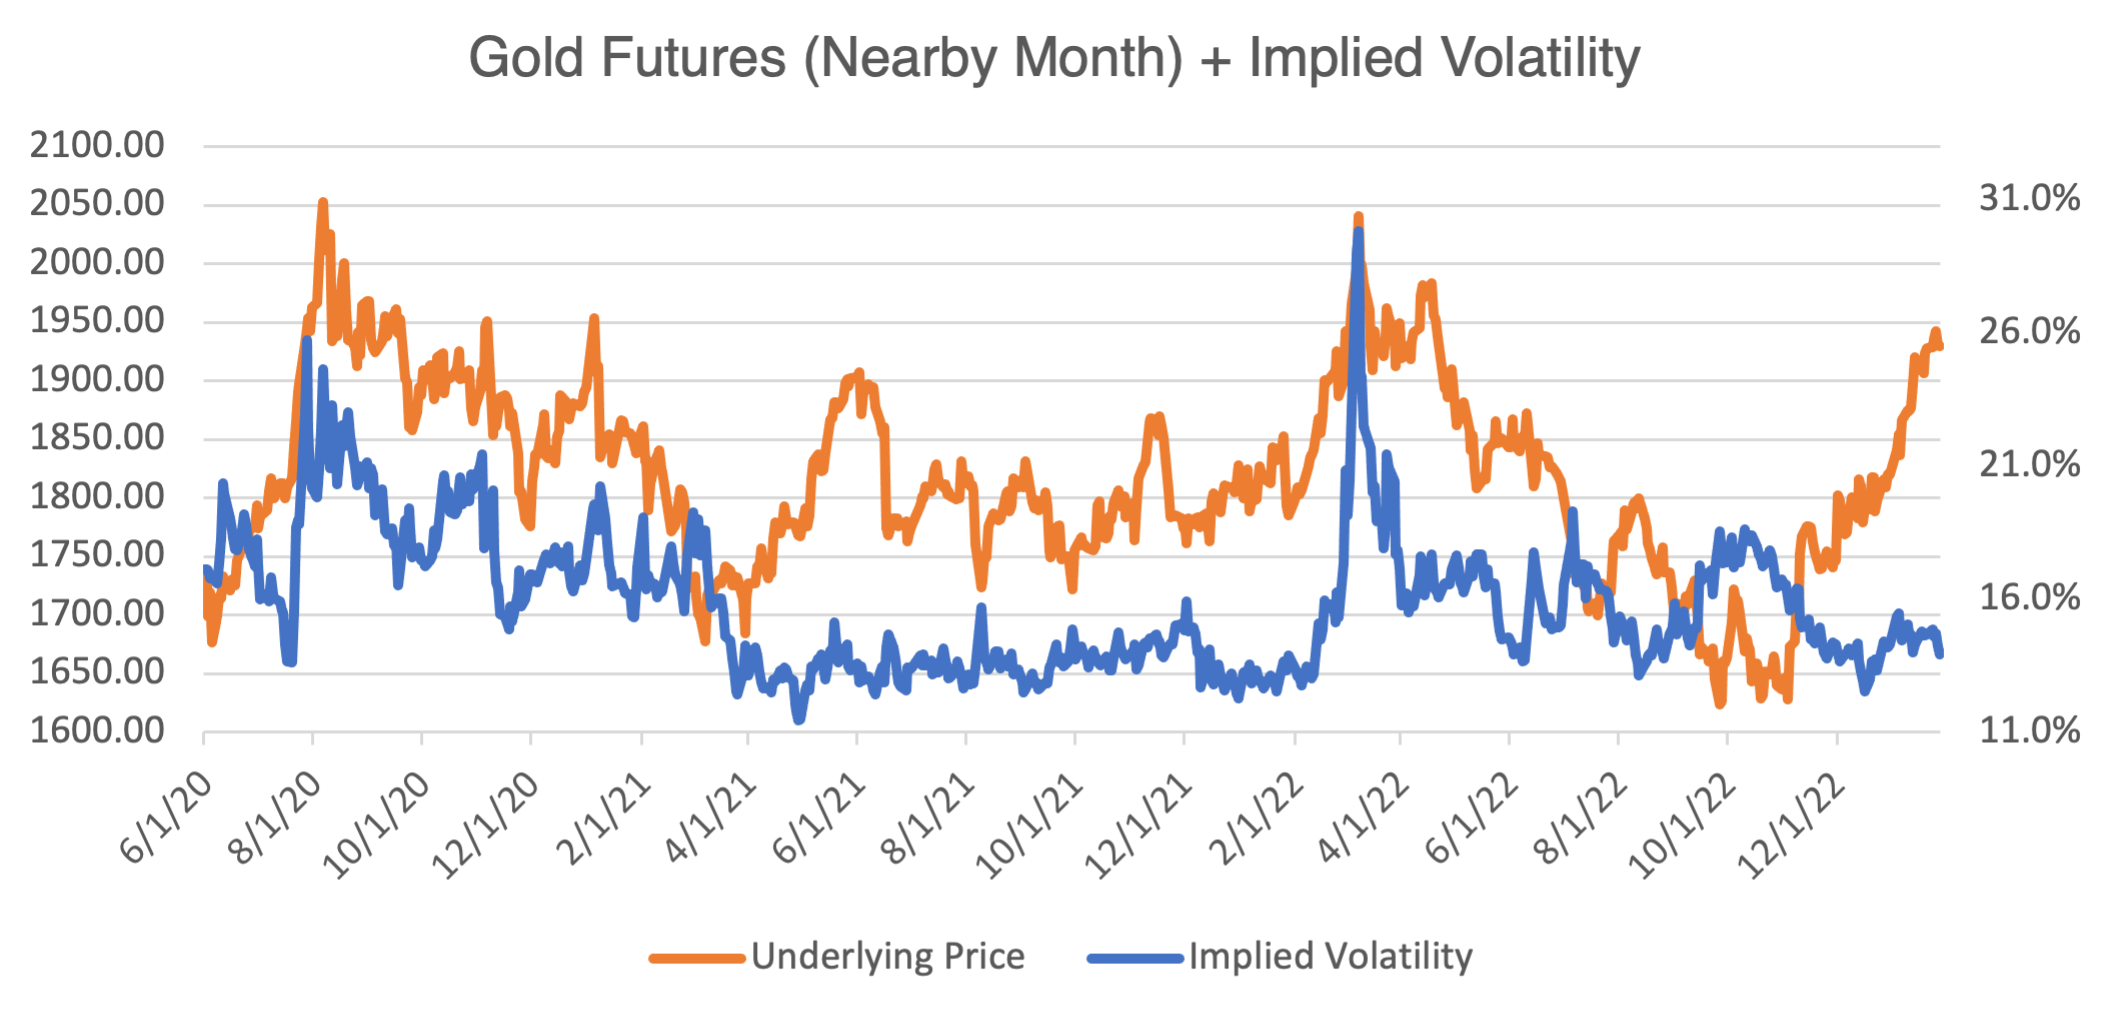
Whether you buy the bullish gold case or not, gold stocks could present interesting opportunities. Let’s begin by looking at the price of gold itself:

Notice that implied volatility for gold, currently trading in the mid-14% region, is relatively low historically. In general, gold volatility displays the same inverse relationship with its underlying price that is prevalent in many other commodities and stocks. As I discussed in last week’s blog, Tesla, ONE More Time, this has important implications for any options strategy.
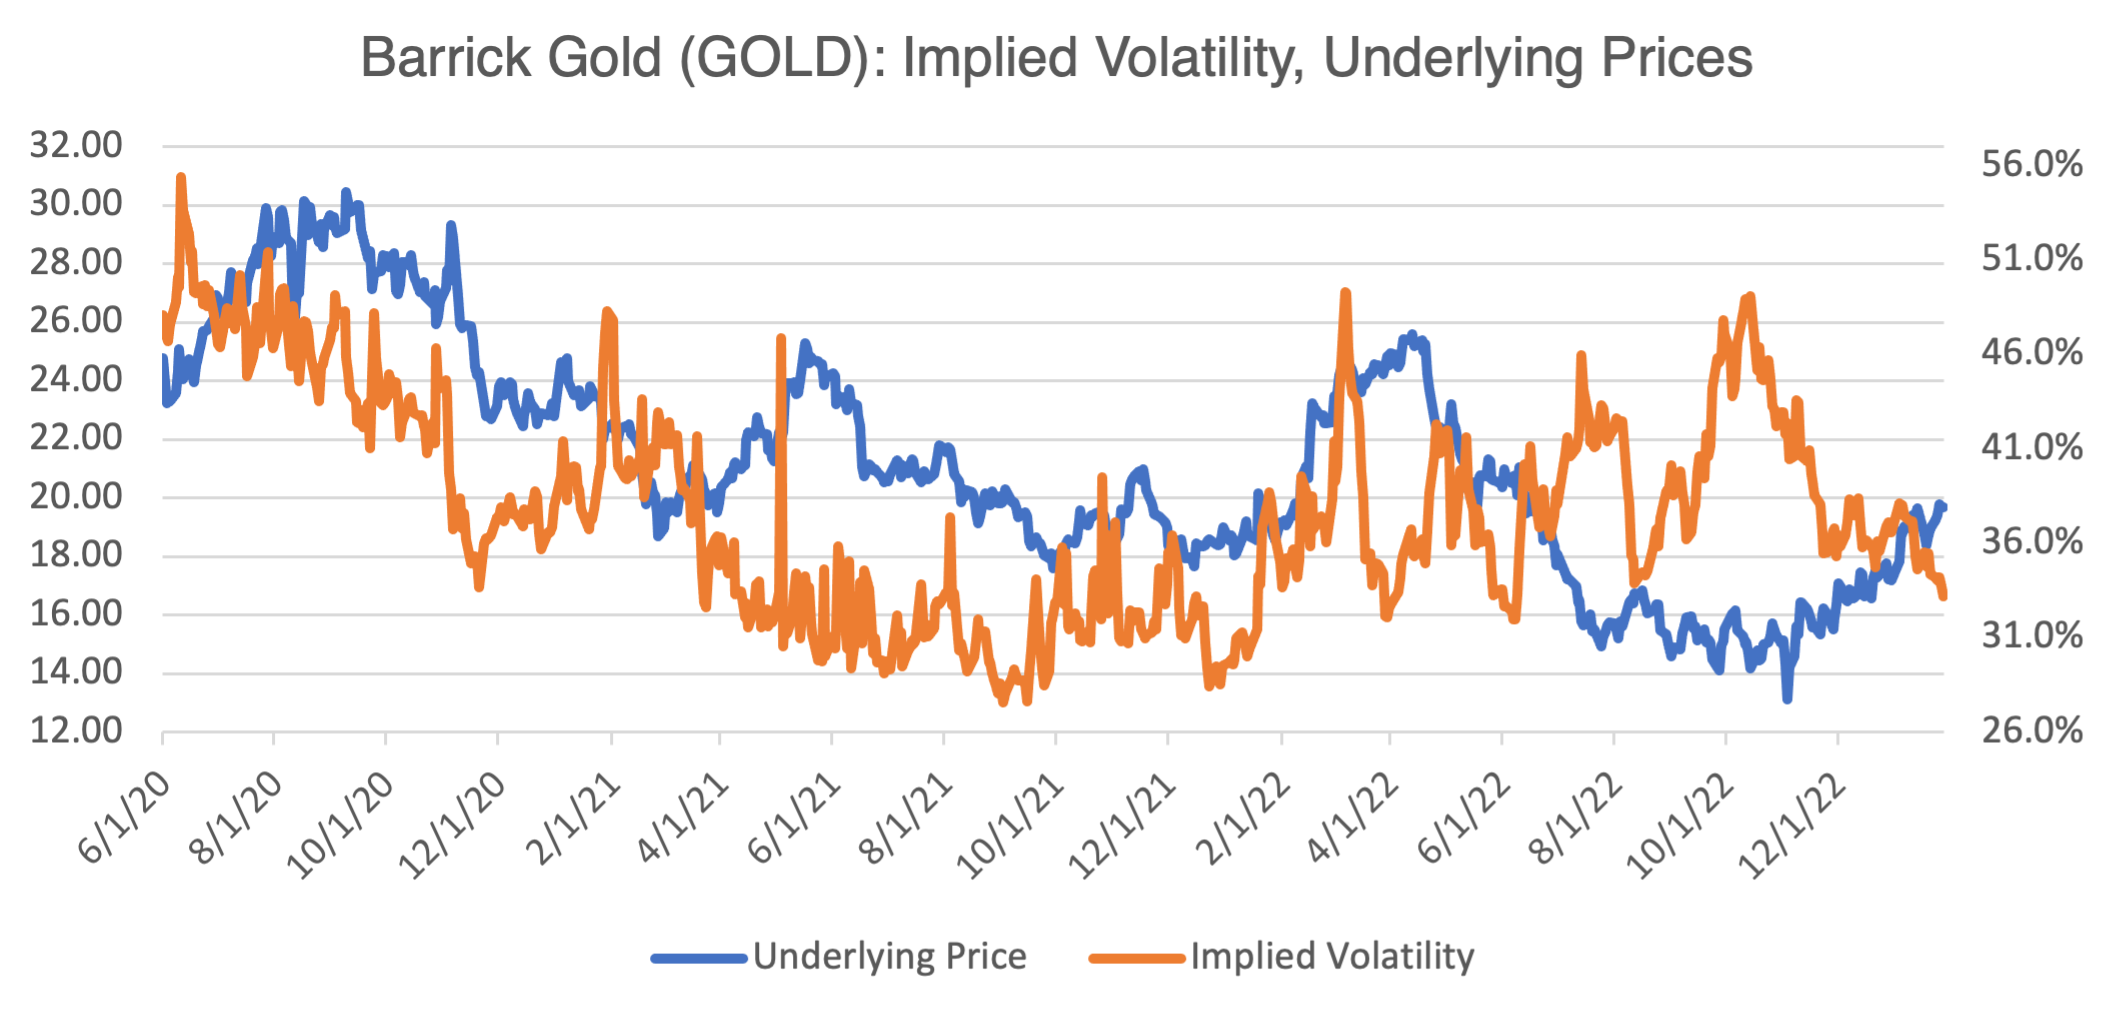
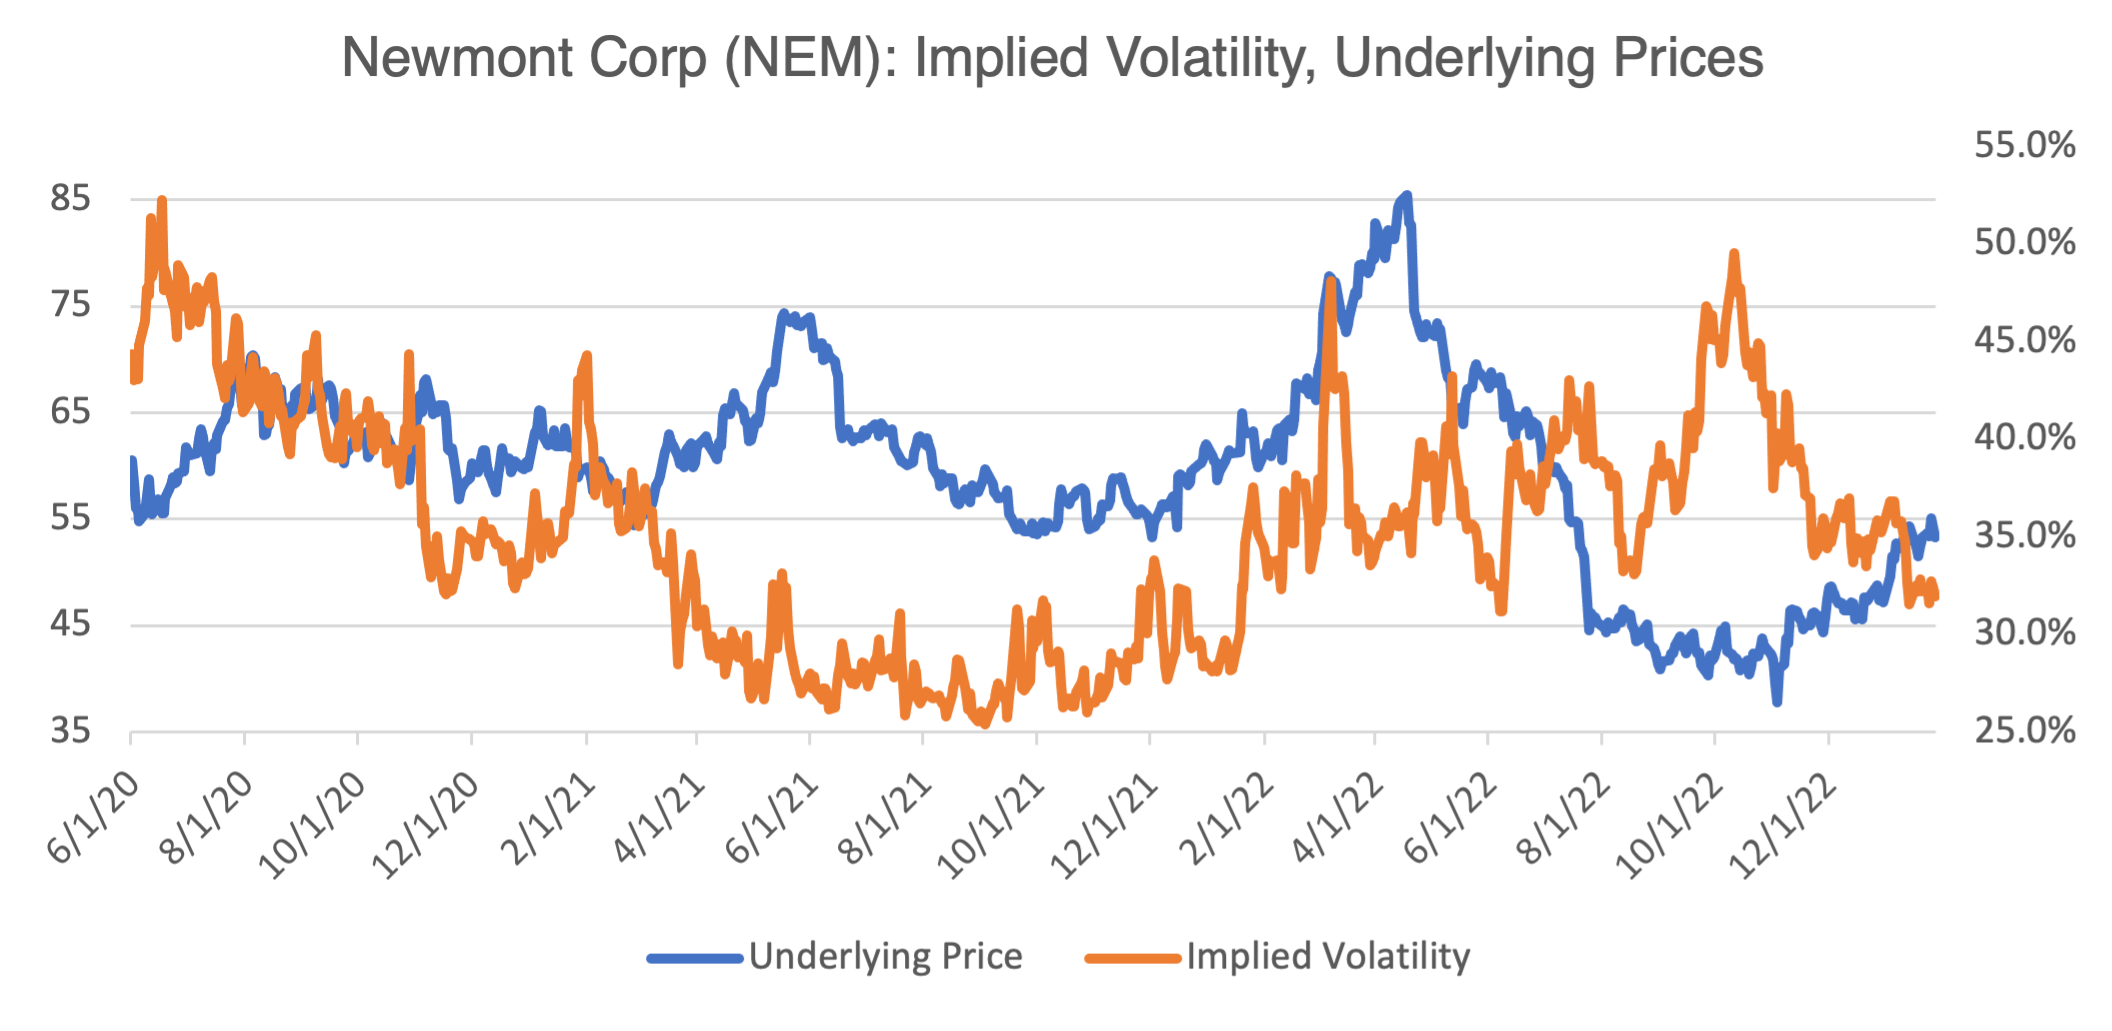
With that as background, let’s examine two of the largest gold stocks, Newmont Corp (NEM) and Barrick Gold (GOLD).


As you can see from the most recent price and volatility action, price increases will most likely be accompanied by lower implied volatility. If you are bullish on gold, option strategies consisting of simple outright long positions, such as long calls, will have declining implied volatility working against them. Spreads, such as bull call spreads, can mitigate this effect. Of course, the opposite is also true. If you are bearish, long puts will benefit from rising implied volatility as gold prices decline. You can experiment with them using our options profit calculator tool.
Something to Worry About
No, not crime or pandemics or asteroids or zombies or anything that’s hanging out in your closet at night. Sorry to disappoint, but it’s a much more mundane subject: the debt ceiling. I know, it’s really kind of boring and most people don’t even know what the debt ceiling is, apart from the fact that the subject comes up every few years or so and then gets resolved, sort of. The last full bore debt ceiling fight was back in 2011, right after the financial crisis. Having lived through it, I can testify that it thoroughly rattled the markets and kept a lot of people up at night, including me. So here we go, again, maybe.
In case you’re kind of hazy on what the details are, the issue is pretty simple — the government runs budget deficits and it has to borrow to pay its bills. More technically, it is the maximum amount the government is allowed to borrow to finance existing obligations. If borrowing hits the debt ceiling, which happened on January 19th, and it isn’t raised by Congress (which has happened more than 100 times since WWII), then the Treasury has to figure out creative ways to keep paying the bills, so-called “extraordinary measures.” These involve altering investments in various government retirement plans, using cash on hand, and tax receipts flowing in after April 15. These can tide the Treasury over for a few months. Janet Yellin has projected that June 5th is the drop dead date, but the date is subject to “considerable uncertainty.”
Why is this important, and very scary? Because if Congress doesn’t raise the ceiling, and the Treasury eventually runs out of options, it will have to default on its obligations. Yes, the D word. In other words, the government won’t be able to pay its bills, something that has never happened in US history.
I don’t have to point out that the US is the largest economy in the world and the steward of its reserve currency, the mighty US dollar. To say that the result of default on the financial markets would be catastrophic is a vast understatement. I think even the most hard-headed members of Congress know this, so similar to using nuclear weapons, they might let the situation get close but not lapse into actual default. However, that’s not to say that the period leading up to the deadline won’t affect the markets. It will, and as we get closer to June or financial insolvency, the greater the effect will be. A high impact/low probability event, but one that investors should be aware of.
Recommendation Corner
Aftershock, from Netflix. Not that many people are familiar with the earthquake that devasted Nepal in 2015. 9,000 people died and 3.5 million were made homeless. That’s about 0.03% and 12.7% of Nepal’s 2015 population of 27.6 million. Now, imagine if a similar natural disaster happened in the US. The Nepal earthquake would equate to about 100,000 people dead and almost 40 million homeless. I think that would get most people’s attention.